Curated OER
A Thanksgiving Survey
Learners conduct a survey. In this math lesson, students design and conduct a survey about Thanksgiving foods. Learners display the collected data in a graph and use the graph to determine what food to serve for a Thanksgiving meal.
Curated OER
Being an Educated Consumer of Statistics
Students examine kinds of data used to report statistics, and create their own statistical report based on any of the four sources of media information (Internet, newspaper, TV, magazine).
Curated OER
Math: Football Fever Fun
Students compile statistics from high school or other football team and construct a spreadsheet on which to record their findings. Using Chart Wizard to analyze the data, they construct charts and graphs for a visual display of the...
Curated OER
Applied Science-Science and Math (2A) Post Lab
Second graders create a graph about TV watching. In this bar graph activity, 2nd graders make a hypothesis about how much TV 2nd graders watch per week. They record their TV watching for a week and bring it to school to create a class...
Curated OER
Significant Science: Statistics for Planet Earth
Ninth graders discover how statistics are used to interpret results of scientific experiments. Students write hypotheses and test the hypotheses by collecting data and organizing the data. Students graph their data to produce a visual....
Curated OER
My Test Book: Tally Charts
In this online interactive math worksheet, students solve 10 problems that require them to read and interpret tally chart data. Students may submit their answers to be scored.
Curated OER
Mean Meadian and Mode
Students apply central tendencies to given data. In this statistics lesson, students calculate the mean, median, and mode as it relates to their data. They collect data and graph it while identifying the way the numbers are ordered.
Curated OER
The Phone Bill Problem
Students write an equation for a linear function. For this algebra lesson, students collect data, plot it and graph it. They identify the equation of the graphed data and define the slope and y-intercept of the graph.
Curated OER
Be the Kiwi
Students analyze linear equation. In this algebra lesson plan, students analyze and graph data. They solve problems involving linear equations and graph lines using the slope and y intercept.
Curated OER
Cockroach Slope
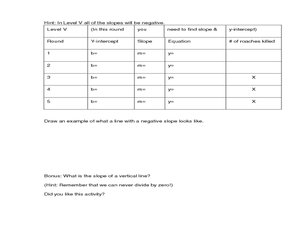
Students identify the slope of linear functions. In this slope lesson, students collect data and graph it. They write equations with no more than two variables and use technology to explain their data.
Curated OER
RIP M&M's
Learners solve theoretical probability problems. In this algebra lesson, students apply the concept of probabilities to solving real life scenarios. They collect data and graph it using experimental probability.
Curated OER
Making Connections-Review Experimental Design and Homeostasis
In this experimental design and homeostasis worksheet, students complete 20 sentences with key terms about designing experiments, gathering data, graphing data and determining controls. They also complete sentences about homeostasis and...
Curated OER
Weight Training
Students conduct a class-wide survey collecting, compiling, and analyzing data about fitness, weight loss, and body image issues. They analyze the relationship between exercise and diet in weight control.
Curated OER
The World Population: Logistic Model
Students explore the various uses of the logistic function. Students use the internet to collect world population data and find a logistic model for their data and use their chosen model to predict future populations.
Curated OER
Scientific Problem Solving
In this problem solving worksheet, students will conduct an experiment to answer this question: "How does watching too much television affect us?" Students will form a hypothesis, collect data, analyze their data, and draw a conclusion....
Texas Instruments
Can You Breathe Like a Pinniped?
Young learners compare the breathing patterns of different animals in this pinniped instructional activity. They examine the breathing pattern of California sea lions and northern elephant seals. Pupils collect, compare and analyze data...
Curated OER
Biological and Agricultural Engineering
Eighth graders explore mathematics by conducting a series of investigations using a colorimeter. In this math lesson, 8th graders explain the purpose of food irradiation. They collect data and graph them.
Curated OER
What's The Teacher's Choice?
Fifth graders explore how to use data and display it using a chart or graph. They use food choices for categories and then gather the data and use the provided chart for display. In small groups students discuss the data and the results.
Curated OER
Science: Backyard Bugs Data Collection
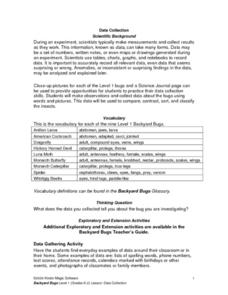
Students practice data collection skills by observing common bugs found in their local environment. Once the data is collected they complete data sheets to compare, contrast, sort, and classify the insects. The lesson includes...
Curated OER
Charting Weight
Sixth graders record the weight of themselves and 3 family over a week, and then use that data to compile 2 bar graphs and 4 line graphs and answer a series of questions.
Curated OER
What Kind of Movies Do You Like To Watch?-- Class Bar Graph
In this math worksheet, students collaborate in collecting data and displaying it on a class bar graph. Students indicate which type of movies they like and plot the information on the graph.
Curated OER
Chances Are
Upper graders examine the concept of probability. They collect data and create a bar graph. They must interpret the data as well. Everyone engages in hands-on games and activities which lead them to predict possible outcomes for a...
Curated OER
Quarter, Nickel, Dime....
An engaging game called, "Quarter, Nickel, and Dime" is presented in this math lesson. Players are given an envelope with slips of paper that represent the three coins. In pairs, they play the game 18 times, and the whole class charts...
Cheetah Outreach
Population Change
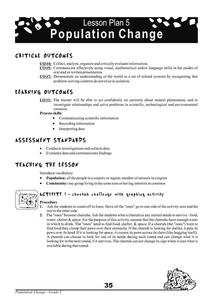
Your youngsters become cheetahs in search of food, water, shelter, and space in a fun physical game that does a fantastic job of representing fluctuating species population based on resources available over years.


