Curated OER
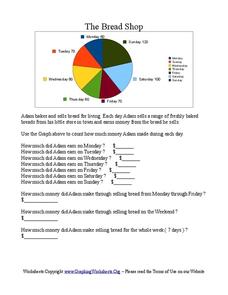
The Bread Shop
For this pie chart worksheet, students use the pie chart graph to count the money Adam made in the Bread Shop. Students complete 10 questions.
Curated OER
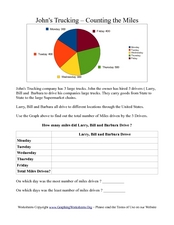
John's Trucking- Counting the Miles
In this graphs worksheet, students analyze a pie graph showing miles driven by three truck drivers in a week. Students fill out a chart in which they calculate total miles driven.
Curated OER
Grasping Graphs
In this grasping graphs worksheet, students solve and complete 3 different types of problems. First, they graph the data described and select the appropriate graph type. Then, students identify the independent and dependent variable. In...
Curated OER
Graphing
Students collect data to create different types of graphs-line, pie, and bar graphs. They use StarOffice 6.0 to create graphs.
Curated OER
Statistics for Graphing
Students use the Internet to access a variety of websites that present statistics and information for use in graphing. They represent sports statistics, geographical measurements, temperatures and more.
Curated OER
Fairy Tales
Sixth graders explore the elements of fairy tales. In this fairy tales lesson, 6th graders analyze several versions of Cinderella from around the world. Students graph fairy tale elements using Excel and create Venn diagrams comparing...
K12 Reader
Displaying Data
It's important to learn how to display data to make the information easier for people to understand. A reading activity prompts kids to use context clues to answer five comprehension questions after reading several paragraphs about...
Math Mammoth
Multiplying Fractions by Fractions
A four-page resource walks learners through the basics of multiplying fractions. The handout is very visual with many diagrams in various colors. By the end of the lesson, learners are given an opportunity to multiply whole numbers with...
Curated OER
Data Handling
For this data handling worksheet, 6th graders solve and complete 4 various types of problems. First, they draw a bar chart to represent the information provided in the table shown. Then, students show beneath the table how to work out...
Curated OER
Diversity of Languages
Learners interpret graphs and statistics to recognise and understand the cultural and linguistic diversity of Australia. They create a profile of the linguistic diversity of the class or school. Students discuss Australia's cultural...
Curated OER
Statistical Inquiry
In this statistical inquiry worksheet, students analyze and interpret a variety of diagrams such as a scatter plot, bar graph and pie charts. They create tables and other diagrams to support given data. This two-page worksheet contains 3...
Curated OER
Histograms and Statistical Graphics
In this statistics worksheet, students solve 6 data problems. They construct a histogram of given data, they create a frequency polygon, and a stem and leaf diagram. Students create a dot plot and a pie chart for given data sets. On the...
Curated OER
Problem-Solving Decisions: Choose the Operation: Problem Solving
In this math operations worksheet, students solve the word problem using the pie chart and following the steps of understand, plan, solve, and look back. Students then answer a final question by choosing the operation and solving.
Curated OER
Colours of the Church Year
In this Colours of the Church Year activity, students use the chart 'Colours of the Church Year' to complete the pie-chart with the Church seasons and fill in the missing words.
Curated OER
Australian Settlers
Students interpret graphs and research events to identify links between events in the world and the arrival and plight of immigrant groups. They discuss the myths about immigration.
Curated OER
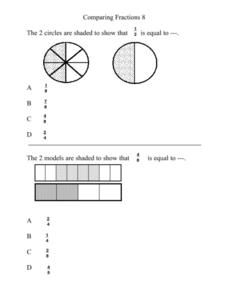
Comparing Fractions 8
In this elementary math worksheet, 5th graders compare fractions using a pie chart and practice finding the values in the multiple choice format.
Curated OER
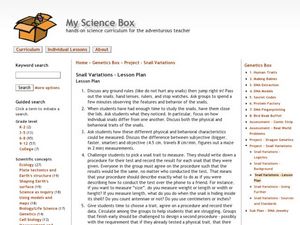
My Science Box
Students investigate snails and their physical and behavioral characteristics. In this investigative lesson plan students create a pie chart to show the results of their findings.
Curated OER
Spreadsheet Graphs
Students create graphs using information from spreadsheets. They select a topic from the following choices: website use, digital cameras, spreadsheets, calculators or educational software. They tally the class results and create an...
Curated OER
Meet The Graphs
Students identify two types of graphs. They analyze and interpret authentic data shown in bar and pie graphs and complete a graph given specific data. Perform simple functions within an Excel document:
Curated OER
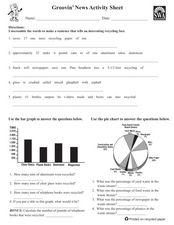
Groovin' News Activity Sheet
In these recycling worksheets, learners complete several activities to learn about recycling. Students complete a word search, word scramble, bar graph, pie chart, research project, class project, and individual project for recycling.
Curated OER
Twelve Days of Christmas
Learners create charts and graphs using a spreadsheet. They chart the number of each gift given day by day from the song, "The Twelve Days of Christmas." They create a bar graph and a circle graph from their data on the spreadsheet.
Curated OER
Calculate Percentages
Sixth and seventh graders study the concept of finding the percent of a number. They calculate the percent of any given number. Pupils describe ways to use calculating percents in their daily life, and change percents into decimals,...
Curated OER
Collecting Data
In this data collection worksheet, students read about how data is collected and organized. They also learn about a hypothesis. Students read through examples of different charts and then answer 23 questions pertaining to data...
Curated OER
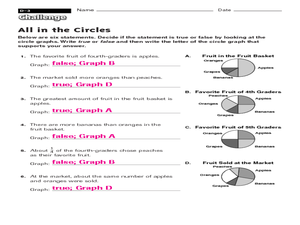
All in the Circles
For this circles worksheet, students use 4 circle/pie chart graphs to answer a set of 6 questions. Answers are included on page 2.


