Curated OER
Comparing And Ordering Decimals
In this decimals worksheet, students compare and order decimals using comparing symbols, ordering from least to greatest, answering word problems, and deciphering a bar graph. A very nice resource.
Noyce Foundation
Ducklings
The class gets their mean and median all in a row with an assessment task that uses a population of ducklings to work with data displays and measures of central tendency. Pupils create a frequency chart and calculate the mean and median....
Curated OER
Halloween Candy/ Sugar Content
Fourth graders examine the amount of sugar contained in Halloween candy by looking at nutritional labels from candy bars. They figure out ways to encourage people to reduce the amount of sugar they eat at this holiday. They look at the...
Curated OER
New York State Testing Program: Mathematics Book 2, Grade 3
For this 3rd grade math standardized test practice worksheet, 3rd graders solve 6 multiple-step open-ended math problems based on New York academic standards.
Curated OER
One Hundred Hungry Ants
Primaries read the book One Hundred Hungry Ants and solve word problems based on the book. In this word problems lesson plan, students will be able to find the factors of a number by organizing counters into equal rows.
Curated OER
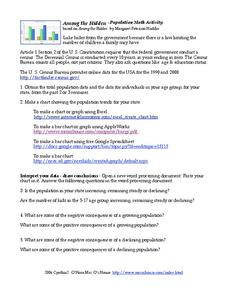
Among the Hidden - Population Math Activity
In this population worksheet, students collect data on population by researching the Census Bureau and then make online graphs and answer short answer questions about the data. Students complete 5 problems total.
Math Mammoth
Grade 1 Worktext
Use graphing, counting, and number lines to help first graders learn about addition and subtraction. An array of worksheets and activities are an excellent resource for your math lesson, whether you are focusing on counting skills or...
Curated OER
Graphing Shark Sizes
Third graders work in cooperative groups to research shark lengths and graph their information. After a lecture/demo, 3rd graders work in groups to find the length of ther shark and chart the results.
Curated OER
Introduction to Graphical Representation of Data Sets in Connection to Cellular Growth
Young scholars practice graphing relationships between variables by studying topics such as exponential growth and decay. They conduct a series of numerical experiments using a computer model and a variety of physical experiments using...
Curated OER
Data Analysis
In this data analysis worksheet, students solve and complete 4 different types of problems. First, they reduce the data provided to find the means, and graph the means in a line graph. Then, students graph the data from each mixture...
Curated OER
What is a Tropical Rainforest?
Students investigate amounts of rainfall in selected world rainforests by creating a bar graph showing rainfall in inches for each. They convert inches to millimeters, and solve word problems having to do with rainfall in selected world...
Curated OER
When Dinosaurs Ruled the World
Students graph the varying sizes of dinosaurs. In this math and dinosaur lesson plan, students view dinosaur models and compare the different shapes and sizes of the dinosaurs. Students complete a dinosaur math activity, read The...
Curated OER
Butterfly Adventure
Students in second grade are paired with fifth grade computer research buddies. They observe the characteristics of caterpillars, and identify the four stages of the caterpillar to butterfly life cycle. They graph the number of...
Curated OER
What's The Teacher's Choice?
Fifth graders explore how to use data and display it using a chart or graph. They use food choices for categories and then gather the data and use the provided chart for display. In small groups students discuss the data and the results.
Curated OER
You Gotta Have Heart
Ninth graders investigate the concept of relations and interpret graphs and tables. They analyze given data and look for a pattern to determine if the numbers represent a function. Students practice solving scientific word problems that...
Georgia Department of Education
Math Class
Young analysts use real (provided) data from a class's test scores to practice using statistical tools. Not only do learners calculate measures of center and spread (including mean, median, deviation, and IQ range), but also use this...
Curated OER
Economics Study Guide
Use this resource as a basic review of economic principles. There are six questions relating to the factors of production, opportunity costs, wants and needs, tangibles and intangibles, and more.
Curated OER
Technobiz
Students examine candy preferences to create a plan in order to improve candy sales. In this technobiz instructional activity, students build spreadsheet and organizational skills by graphing and calculating data. Students are introduced...
Curated OER
Marketing Occupations
Students identify and explain the variables effecting supply and demand in the marketing industry. Then they define the terms supply and demand and graph supply and demand curves on a standard grid. Students also formulate what happens...
Curated OER
Party Time
Learners design a budget to plan for a class party. In this problem solving instructional activity, students devise a budget with a limit of fifty dollars for a class party. Learners discuss and estimate the amount of money needed for...
Curated OER
Playing With Probability
Students rotate through work stations where they compute problems of theoretical and experimental probability. In this probability lesson plan, students use simulations of a lottery system.
Curated OER
Exploring the Stock Market
Learners explore their options in stocks. In this algebra lesson, students create a portfolio for their future in stocks. they discuss their choices with a broker and presents their portfolio to the class.
Curated OER
The Dog Days of Data
Learners are introduced to the organization of data This lesson is designed using stem and leaf plots. After gather data, they create a visual representation of their data through the use of a stem and leaf plot. Students
drawing...


