Curated OER
Data Handling: Bar Chart Showing Frequency
In this bar graph learning exercise, students analyze a bar graph showing soccer goals scored. Students then use the data to solve 7 problems.
Curated OER
Read a Bar Graph
In this bar graph worksheet, students use a bar graph of favorite zoo animals to solve 6 simple word problems. Houghton Mifflin text is referenced.
Curated OER
Bar Graphs
In this bar graph worksheet, students complete word problems about a bar graph containing the results of student's rock collections. Students complete 8 problems.
Curated OER
Bar Charts and Pictographs: How can they help us?
First graders work with manipulatives to solve various math problems by using concrete objects to solve a list of problems . They create and evaluate bar graphs and write a statement about the information on their bar graph.
Curated OER
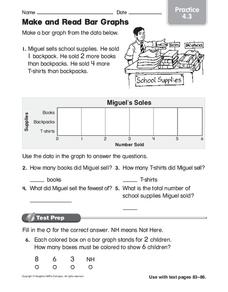
Make and Read Bar Graphs
In this bar graphs worksheet, students make a bar graph about the sale of school supplies with the data presented in one story problem.
Curated OER
Use a Bar Graph: Practice
In this bar graph worksheet, students use data in a bar graph to solve 2 word problems, 2 mental math problems and 1 multi-step problem. Reference to a Houghton Mifflin text is given.
Curated OER
Blank Bar Graph
In this math graphing worksheet, students use a blank bar graph grid to display data. The intervals are counting by 2, up to 14. There are no problems provided.
Curated OER
Classroom Supplies
Challenge young mathematicians to buy classroom supplies by staying within the means of a $1,000 budget. The mathematical activity provides learners with the opportunity to decide what items from the supply list would benefit a class of...
Curated OER
Graphing Data
Seventh graders solve and graph 10 different problems that include various questions related to data on a graph. First, they create bar graphs to display the data given. Then, pupils determine the random sample of a population listing...
Curated OER
Comparing School Bus Stats
Engage in a instructional activity that is about the use of statistics to examine the number of school buses used in particular states. They perform the research and record the data on the appropriate type of graph. Then they solve...
Curated OER
Leveled Problem Solving: Histograms
In this using data, frequency table, and histogram to solve word problems worksheet, students solve problems about prices of toys and numbers of toys sold to solve consumer mathematics problems. Students solve six problems.
Curated OER
Reading and Interpreting Graphs
In this reading and interpreting graphs worksheet, students answer 8 word problems that involve reading information from a graph about pizzas. Students then review a second graph centered on music and answer 12 questions.
Baylor College
Living Things and Their Needs: The Math Link
Enrich your study of living things with these cross-curricular math activities. Following along with the story Tillena Lou's Day in the Sun, learners will practice addition and subtraction, learn how to measure volume and length, work on...
Yummy Math
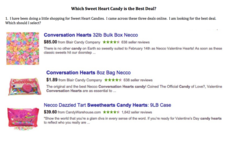
Which Sweet Heart Candy Is the Best Deal?
Get the most Valentine's candy for your money with a fun math activity! After examining three deals for buying candy hearts in bulk, young mathematicians decide which deal is the best and use bar graphs to demonstrate their claim. They...
Curated OER
Problem Solving: Use a Graph: Problem Solving
In this bar graph worksheet, students read the word problem and use the bar graph to complete the problem solving questions for understand, plan, solve, and look back.
Curated OER
Graphs
In this bar graph instructional activity, 6th graders complete word problems based on a bar graph of number of cans of food collected. Students complete 8 problems.
Curated OER
Graphs
In this graphs activity, students complete word problems about a bar graph of tickets sold for the drama club. Students complete 8 problems.
Curated OER
BIG Pumpkins!
How big is the biggest pumpkin you've ever seen? Did it weigh over a ton—literally? Young learners view pictures of some record-breaking pumpkins, including some that weighed over 1,300 pounds, before answering five word problems about...
Curated OER
Wheat Kernels Bar Graph
Third graders create a bar graph to record how many kernels were in a wheat stalk. They write in math journals two questions from interpreting the graph. They solve math problems from other students.
Curated OER
Misleading Graphs
Students explore number relationships by participating in a data collection activity. For this statistics lesson, students participate in a role-play activitiy in which they own a scrap material storefront that must replenish its stock....
Curated OER
Food for Class Party
In this interpreting a bar graph and math word problems worksheet, 2nd graders read the information about choices of food for a class party and answer various multiple choice questions. Students solve 25 problems.
Curated OER
Comparing Data on Graph A and Graph B
Second graders gather and graph data. In this graphing lesson, 2nd graders collect data and graph this information using tally charts, bar graphs, pictographs, or tables. They make predictions about the outcomes.
Curated OER
GSE Foundations of Algebra: Equations and Inequalities
Need lessons on writing and solving one- and two-step linear equations and inequalities, as well as systems of equations? This comprehensive 106-page module from the Georgia Department of Education contains many different lessons for a...
Curated OER
Blank Bar Graph- Intervals of 3
In this bar graph worksheet, students use the blank bar graph grid to display data. The interval is counting by 3. There are no problems given.


