Curated OER
Multiply Boxplots
Students identify the mean, quartiles and range of a boxplot. In this statistics instructional activity, students identify cooperative boxplot as it relates to the data. They make conjectures about students grade distribution.
Curated OER
Center and Spread
Young scholars collect and analyze data. In this statistics lesson, students define and calculate the range, median and standard deviation. They identify reasons for a skewed distribution.
Curated OER
Center of Mass
Students identify the geometric mean of their data. In this statistics lesson, students collect data and graph their findings. They identify the mean, range and mode.
Curated OER
Z-Scores
Learners solve problems by identifying the percent of area under the curve. In this statistics lesson, students discuss z-scores as they calculate the different percentages under the bell curve. They calculate the standard deviation.
Curated OER
Assessing Normalcy
Students define normal distribution as it relates to the bell curve. In this statistics lesson, students use the central tendencies of mean, median and mode to solve problems. They plot their data and draw conclusion from the graphs.
Curated OER
Normal Probability Plot
Young scholars analyze the graph of a distribution. In this statistics lesson, students define skewed or mound shape distribution as they investigate the data behind the graph. They define and plot outlier as well as normal probability.
Curated OER
Looking Normal
Students identify the shape of a function. In this statistics lesson, students plot the data collected. They analyze their data for positive, negative or no correlation. They find the line of best fit.
Curated OER
Percentiles
Students analyze the bell curve and make predictions. In this statistics instructional activity, students calculate the percentile to the left of the curve. They then are given the percentile and create the graph from the data.
Curated OER
Probability Distributions
Students collect and plot data on a graph. In this statistics instructional activity, students analyze the distribution of a sample and predict the outcome. They find the line of best fit and discuss what would make the sample larger.
Curated OER
Why NP Min?
Students calculate the normal distribution. In this statistics lesson plan, students use the normal distribution to estimate binomial distributions. They define when to use NP and n(1-p) to make approximations.
Curated OER
Sampling Distributions
Learners analyze sampling from different population. In this statistics lesson plan, students define the meaning of sample sizes and what causes an increase or decrease. They graph their data on the Ti calculator and draw conclusion from...
Curated OER
Why Divide by N-1?
Learners identify the mean and variance. In this statistics activity, students calculate the population variance using the N as a divisor. They draw the relationship of dividing by N and N-1.
Curated OER
Meaning of Alpha
students define the alpha level. In this statistics lesson, students identify what makes the "null rejected" and discuss the data surrounding the null. They observe the meaning of alpha as it relates to the bell curve.
Curated OER
Meaning of Power
Students graph exponential and power functions. In this statistics lesson plan, students test a specific hypotheses and draw conclusion. They use the graph of polynomials to test and draw their conclusions.
Curated OER
The Energy of Music
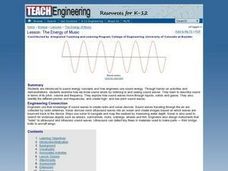
Students discover how engineers use sound energy. They participate in hands-on activities in which they discover how we know sound exists. They identify different pitches and frequencies as well.
Curated OER
Portable Sundial
Students work together to identify the accuracy of sundials. They track the position of the sun and create a shadow plot. They discover the difference between real time and clock time.
Curated OER
Nature's Magic Elixir
Students do research to discover the importance of water in the world and its effect upon our daily lives. They will also appreciate the beauty of water and how it is so adaptable within nature.
Curated OER
ourney Through Time: Art Tells the History of Nebraska
Fourth graders discuss early Nebraskan history. They view and discuss the painting "Sodhouse Family." Students are directed to the artistic elements of the painting, such as the horizon line. They follow a prescribed procedure to create...
Curated OER
Christopher Columbus WebQuest
Fourth graders are introduced to the voyages of Christopher Columbus to the New World. In groups, they use the Internet to complete a WebQuest on what conditions were like on the ships. They write journal entries and complete a worksheet...
Curated OER
Families of Functions
Students investigate families of functions. In this families of functions lesson, students discuss how changing a functions parameters affect its' graph. Students vary slope and y-intercepts of linear functions. Students stretch and...
Curated OER
Weather Station
Students create their own barometer, precipitation, rain gauge, anemometer, and more with their weather stations. In this weather station lesson plan, students access on line websites on how to make their own weather tools.
Curated OER
I Know Where You Are!
Students study what a GPS is and use it to challenge themselves and find positions on a map. For this investigative lesson students find various points on a map using a GPS system and answer questions on a worksheet.
Curated OER
What is a Solution to a System?
Learners define the solution to a system of equation. In this algebra lesson, students graph two line on the TI calculator and identify the point of intersection if there is any. They find one, zero or infinitely many solution and...
Curated OER
Rational Functions
Young scholars evaluate rational functions. In this precalculus lesson, students make observations and define what makes a rational function and what makes a linear function. They use the Ti calculator to visualize the different graphs.


