Curated OER
Bell Curve
Students explore averages by completing a data analysis activity. For this bell curve lesson, students measure different food items and plot their measurements on a X and Y axis. Students create bell curves around the average weight or...
Curated OER
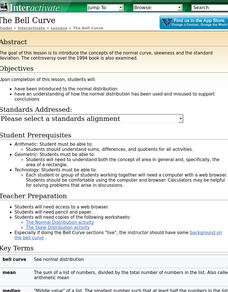
The Bell Curve
Learners are introduced to the concepts of the normal curve, skewness and the standard deviation. They discuss how the normal distribution has been used and misused to support conclusions.
Curated OER
The Bell Curve
High schoolers explore the concept of the bell curve. In this bell curve lesson, students discuss the controversy associated with the bell curve. High schoolers use an applet to explore a normal distribution. Students discuss mean,...
Curated OER
The Bell Curve
Pupils are introduced to the normal distribution and examine the bell curve controversy.
EngageNY
Using a Curve to Model a Data Distribution
Show scholars the importance of recognizing a normal curve within a set of data. Learners analyze normal curves and calculate mean and standard deviation.
Curated OER
Assessing Normalcy
Young scholars define normal distribution as it relates to the bell curve. In this statistics lesson, students use the central tendencies of mean, median and mode to solve problems. They plot their data and draw conclusion from the graphs.
Radford University
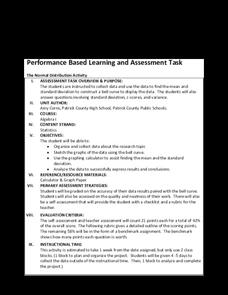
The Normal Distribution Activity
For whom does the bell fit? Pupils begin by working in groups gather data on three different variables. They then determine the mean and standard deviation of each data set and create bell curves. To finish, they answer guiding questions...
Curated OER
Contours, Curves & Lines
Young scholars discover how straight lines and curves function in both art and the science of conservation tillage by building model "hills" and experimenting on them.
Curated OER
Exploring the Normal Curve Family
Students find different characteristics of the bell curve. In this statistics lesson, students analyze a family for a specific characteristic. They identify the shape, center, spread and area as they analyze the characteristic of the...
Curated OER
Z-Scores
Learners solve problems by identifying the percent of area under the curve. For this statistics lesson, students discuss z-scores as they calculate the different percentages under the bell curve. They calculate the standard deviation.
Curated OER
Probability
Students complete various activities for probability. In this probability lesson, students use coins, cubes, peanut butter and jelly, playing cards, number cubes, darts, and a Gauss Curve to study probability. Students must orally...
Curated OER
Being an Educated Consumer of Statistics
Students examine kinds of data used to report statistics, and create their own statistical report based on any of the four sources of media information (Internet, newspaper, TV, magazine).
Curated OER
Percentiles
Students analyze the bell curve and make predictions. In this statistics lesson, students calculate the percentile to the left of the curve. They then are given the percentile and create the graph from the data.
Curated OER
Mean, median, and mode... Use the data
Ninth graders participate in a lesson focused on the concept of basic statistics. They find the mean, median, and mode of different data sets. More advanced students could practice creating a bell curve from the data.
Curated OER
Boxplots Introduction
Young scholars describe the pattern of a bell curve graph. In this statistics instructional activity, students move data around and make observation about the mean, and the quartiles. They define boxplot, outlier, range and other...
Curated OER
Meaning of Alpha
students define the alpha level. For this statistics lesson, students identify what makes the "null rejected" and discuss the data surrounding the null. They observe the meaning of alpha as it relates to the bell curve.
Curated OER
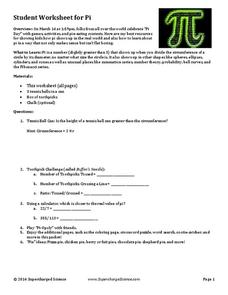
Worksheet for Pi
Who needs a pie-eating contest when you have a pi-ology game! Celebrate March 14th with a fun board game about pi and other geometric concepts. As learners answer questions about geometry, they move around the board to collect tokens.
Curated OER
Self-Fulfilling Prophecy in African American Students: Exploring African American Achievers
Fifth graders are introduced to ways to increase their self-esteem. As a class, they share their specific talents under three categories. In groups, they use the internet to research the lives of various African Americans making sure...
Curated OER
Design Team Challenge
Students work in groups to build a robot. In this robotics lesson, students create an electronic robot and program it to follow directions. They create an obstacle course for the robot to follow and test its performance.
Curated OER
Patterns of Evolution and Selection
Can your young biologists interpret population graphs, match macroevolution patterns and descriptions, and answer multiple choice questions about evolution? Find out with a comprehensive three-page quiz covering some specific examples of...
Curated OER
EOC Review G
In this end of course review, students factor expressions, interpret statistic problems, and identify the maximum and minimum of equations. This two-page worksheet contains 5 multi-step problems.
Curated OER
The Statistical Nature of Test Data
Young scholars investigate the properties of various metals. They conduct an experiment and gather the data by putting into the proper statistical graphs. The data is analyzed and conclusions are formed according to the properties of the...
Curated OER
Cruise Conditions Graphing & Statistics
Students monitor weather conditions for an eighteen day period at a specific location. The temperature of both air and water is taken and the mean, median, and mode calculated. Differences between the highest and lowest recordings are made.
Curated OER
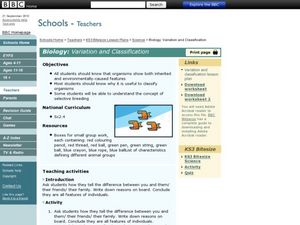
Biology: Variation and Classification
Students investigate classification of different animal groups. In this biology lesson students list characteristics of themselves and others they know to show differences and how they are classified. Students then answer questions about...
Other popular searches
- Making a Bell Curve
- Using the Bell Curve
- Bell Curve Coin Toss
- Bell Curve Experiments
- Bell Curve and Probabilities


