Concord Consortium
Function Project
What if a coordinate plane becomes a slope-intercept plane? What does the graph of a linear function look like? Learners explore these questions by graphing the y-intercept of a linear equation as a function of its slope. The result is a...
Shodor Education Foundation
Multi-Function Data Flyer
Explore different types of functions using an interactive lesson. Learners enter functions and view the accompanying graphs. They can choose to show key features or adjust the scale of the graph.
Shodor Education Foundation
Linear Inequalities
An interactive lesson helps individuals learn to graph inequalities in two variables. Scholars can adjust the interactive to present the inequalities in standard or slope-intercept form.
Curated OER
Reading Graphs
Students plot functions on the Cartesian coordinate plane. They explore lines and parabolas. Students analyze graphs and answer questions about the information presented on the graph using an online program.
Curated OER
Graph Figures From Equations
Students explore the concept of graphing figures from equations. In this graphing lesson, students use Microsoft Math to graph figures from equations and write equations from graphed figures.
Curated OER
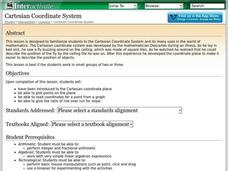
Cartesian Coordinate System
Students explore the concept of the coordinate plane. In this coordinate plane lesson, students graph points on the coordinate plane using an applet. Students graph functions using an applet. Students play a Maze Game where they must...
Curated OER
Variables and Patterns: Determining an appropriate scale while graphing
Sixth graders determine appropriate scales when graphing data. In this graphing lesson, 6th graders use an the applet "Graph It" to determine what is an appropriate scale for their data.
Curated OER
Graphing Linear Equations with Calculator
Students graph lines using the calculator. In this algebra lesson, students graph lines of equations in the form y=mx+b. They input equations into the TI Calculator and graph using the slope and intercept. They analyze the graph for...
Curated OER
More graphing situations by making a table
Students make a table and graph plotting points. For this algebra lesson, students graph linear equations on a coordinate plane. They calculate the rate of change and analyze the graph for extrapolation.
Curated OER
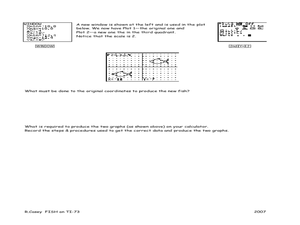
Fishing for Points
Learners explore the concept of ordered pairs. In this ordered pairs lesson plan, pupils list the ordered pairs of a graph in the shape of a fish. They use their calculator to translate the fish using lists, then translate the fish left,...
Curated OER
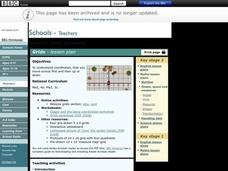
Grids
Take your study of coordinates online! Groups of students complete an online graphing introduction, plotting the points of virtual objects. A worksheet is included for extra practice.
Curated OER
Exploring Transformations with Matrices
A page right out of the Holt Geometry book. Use a graphing calculator and graph paper to explore transformations with matrices.
Curated OER
Perplexing Puzzles
Elementary and middle schoolers explore scatter plots. In this graphing lesson, pupils work in small groups and use jigsaw puzzles to develop a scatter plot. Younger students may develop a bar graph.
EngageNY
Structure in Graphs of Polynomial Functions
Don't allow those polynomial functions to misbehave! Understand the end behavior of a polynomial function based on the degree and leading coefficient. Learners examine the patterns of even and odd degree polynomials and apply them to...
Blogger
Standard Form of a Linear Equation
Organize your learners with this well-laid-out note-taking printable. Note blanks are organized to allow for two strategies of graphing an equation given in standard form.
101 Questions
Best Midpoint
Develop a strong understanding of what it means to be a midpoint. Learners analyze the angles, coordinates, and lengths of segments and their approximated midpoints. They use their analyses to develop a formula to rank four attempts at...
Curated OER
Graphing X, Y, Z
Seventh graders explore how proportion controls the image of a drawing. They examine a coordinate plane and discuss plotting. Student experiment drawing an object one size, and then drawing an identical object on a different scale.
Curated OER
Graphing Linear Equations with Two Variables
Can your class solve linear equations in two variables? They will be able to after they engage in this instructional activity. Individuals graph linear equations in two variables using slope and intercept and identifying the relationship...
Curated OER
Graphing Quadratic Equations with a Coefficient of One
This is a teacher page for a lesson and does not include any materials to support the lesson. Students graph quadratic equations with a coefficient of one and create a table of values to graph a quadratic equation. They plot the values...
Curated OER
Trigonometric Form of Complex Numbers
This instructional activity is written from the perspective of a student teacher. A step by step instructional activity in which the class works on the trigonometric form of complex numbers. They convert between trigonometric and complex...
Curated OER
Cartesian Coordinates
Students investigate rational numbers through data analysis and statistics. For this algebra lesson, students represent, rename, compare and order rational numbers. They collect and represent data correctly on a graph.
Curated OER
Find Parabolas through Two Points
Your learners will write quadratic functions whose graphs include specific points and explore how these graphs are related to each other.
Curated OER
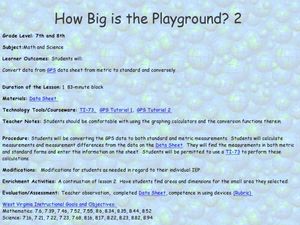
How Big Is The Playground?
Students calculate the standard and metric measurements of a playground. In this measurement lesson, students use GPS coordinates and graphing calculators to determine the dimensions of an area outside of the school in both standard and...
Curated OER
Proportionality in Tables, Graphs, and Equations
Students create different methods to analyze their data. In this algebra lesson, students differentiate between proportion and non-proportional graph. They use the TI-Navigator to create the graphs and move them around to make their...
Other popular searches
- Coordinate Graphing Pictures
- Holiday Coordinate Graphing
- Graphing Coordinate Planes
- Coordinate Graphing Worksheets
- Cartesian Graphing Pictures
- Coordinate Graphing Art
- Using Coordinate Graphing
- Coordinate Graphing Practice
- Algebra Coordinate Graphing
- Coordinate Graphing Distance
- Graphing Coordinate Pairs
- Graphing on a Coordinate Grid


