Curated OER
What's Your Line?
Fifth graders collect temperature readings over a period of time, enter the information into a spreadsheet and choose the appropriate graph to display the results.
Curated OER
Looking for More Clues
Fifth graders explore how to collect data and display it on a bar and circle graph.
Curated OER
Water: From Neglect to Respect
The goal of this collection of lessons is to make middle schoolers more aware of the ways in which they are dependent upon water to maintain their standard of living. Learners compare water use in Lesotho to water use in the United...
Curated OER
WebQuest: Thrills and Spills- Pick Your Park!
Young scholars participate in a WebQuest in which they must determine which amusement park is the "median priced" park. Students visit park websites to accumulate prices for parking, activities, restaurants, and gift shops.
Curated OER
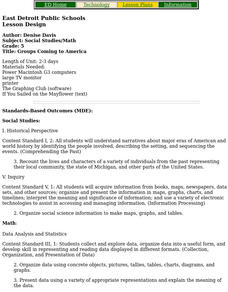
Groups Coming to America
Fifth graders use text or other references to locate different types of information about the Mayflower and pilgrims. They create a presentation for lower elementary classes about the Pilgrims.
Curated OER
A Closer look at Oil and Energy Consumption
Upper graders analyze basic concepts about the consumption, importation and exportation of the worlds oil production. They create several graphs to organize the data and draw conclusions about the overall use of oil in the world.
Curated OER
Applied Science - Science and Math Lab 4B
Learners experiment with the combination of vinegar and baking soda. In this applied science lesson, future scientists compare qualitative and quantitative data collected from their exploration. Then they work together to analyze and...
Curated OER
Histograms
In this histograms learning exercise, students solve 5 word problems based on a histogram of presidential ages at their inauguration. Next, students create a frequency table and a histogram based on a list of data which shows the average...
Curated OER
Building a Pill Bug Palace
Learners make "pets" of isopods (potato bugs) to determine their preferred environment and food sources. They record their results on a bar graph and in a scientific report.
Curated OER
Graphing
Fifth graders create graphs based on climate in South Carolina. They read and interpret information in a chart and construct a graphy from the information in the chart. They create a spreadsheet using Excel and publish 2 graphs.
Curated OER
Creating Climographs
Students chart statistical information on graphs, interpret the information and use it to explain spatial relationships, and identify the relationship between climate and vegetation.
Curated OER
Misleading Graphs Lesson Plan
Students design and build water balloon catchers from random scrap materials, while taking into consideration a multitude of variables including: cost, maintenance, total capacity, etc.
Curated OER
Download and Analyze
Students download information from a NASA website into a database. They transfer it to a spreadsheet by completing the information and analyze the information. They determine temperature averages, mode, and graph the results. They write...
Curated OER
Butterfly Adventure
Students in second grade are paired with fifth grade computer research buddies. They observe the characteristics of caterpillars, and identify the four stages of the caterpillar to butterfly life cycle. They graph the number of...
Curated OER
Best Guesser
Fifth graders develop strategies for estimating ages, and illustrate results by graphing and interpreting scatter plots to compare x and y coordinates.
Curated OER
Driving Forces Forestry In Canada
Students discuss the natural and economic impact of forests and forestry. Using given statistics they construct different types of graphs in which they make observations and draw conclusions.
Curated OER
Heart Smart in a Heart Beat
As an introductory activity, young statisticians measure their heart rate at rest and after exercise and compute the mean and median, and create a box & whisker plot. This is followed by watching a video (that no longer seems to...
Curated OER
Statistics: Misleading or Accurate?
Students explore the concept of misleading statistics. In this misleading statistics lesson, students play a game of tag and graph the number of times each student gets tagged. Students use the graph to determine the fastest runner in...
Curated OER
Investigating the Probability
Learners investigate probability using coins and dice. They collect data, graph, organize and interpret data. They predict, describe, compare, compute and draw conclusions based on what they observe and record.
Curated OER
A Tasty Experiment
Students work together to determine if smell is important to being able to recongize food by taste. They try different foods with different textures and hold their nose. They create a graph of their results.
Alabama Learning Exchange
The State Capital of Stem and Leaf
Students explore the concept of stem and leaf plots. In this stem and leaf plots lesson, students plot the 50 US states' capitals on a stem and leaf plot according to the first letter of each state. Students compare their stem and leaf...
Curated OER
Bird Feeding and Migration Observation
Students research bird migration and build a bird house. For this bird lesson plan, students research the birds in their area and where they migrate to. They also build their own bird house and record data on what kinds of birds come to...
Curated OER
The Great Chile Challenge
Fifth graders gather data, create a graph, and interpret information. They build vocabulary by negotiating the ideas that go into the graphs which they create. They use Excel to print a variety of graphs based on how much they like Chile...
Curated OER
Checking County Numbers
Students use their county's information page to gather information about their community. Using the information, they create graphs from the tables provided and interpret the data. They write a paragraph showing their interpretation of...


