Curated OER
M&M Graphing and Probability
Students sort, classify, and graph M & M's. They create pictographs and bar graphs with the colors and numbers in each bag of M & M's. They calculate the ratio and probability based on class results.
Curated OER
Bar Graphs
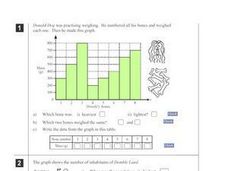
In this bar graph instructional activity, learners complete word problems about a bar graph containing the results of student's rock collections. Students complete 8 problems.
Curated OER
Choose an Appropriate Graph
In this graphs worksheet, students solve 6 fill in the blank problems where they choose the most appropriate type of graph for each set of data and explain why they chose that type. Students use bar graphs, histograms and circle graphs....
Curated OER
Learning to Make Bar Graphs
Students construct bar graphs using the results from various experiments. In this graphing lesson, students review data from a previous experiment and demonstrate how to construct a bar graph. Students use a checklist to ensure...
Curated OER
Bar Graph Lesson
Students make a bar graph. In this graphing lesson, students discuss why bar graphs are used and are shown bar graph examples. Students create their own bar graph to compare the heights of different things around the world. Students...
Curated OER
Bar Graphs
In this bar graphs worksheet, learners, working with a partner, explore how to read and analyze the five answers to one mathematical bar graph.
Curated OER
Favorite Candy Bar Graph
Students decide on six different types of candy bars to include in a data collection activity. Working in small groups, they survey a target group in a set amount of time. They access a Internet based graphing tool to create a bar graph...
Curated OER
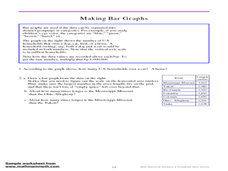
Making Bar Graphs
In this bar graph learning exercise, students answer short answer questions about bar graphs. Students answer 1 question about a bar graph about a cat, and 3 questions about a bar graph about U.S. rivers.
Curated OER
Mean, Mode and Bar Graphs
In this mean, mode and bar graphs learning exercise, 5th graders analyze the data given, then answer three questions about a bar graph and the data shown.
Curated OER
Easter Bar Graph - (B)
In this math review activity, students complete addition, subtraction, multiplication, and division problems and put their answers into a bar graph that represents calories. Students complete 13 problems and 1 graph.
Curated OER
Easter Bar Graph - C
In this math review instructional activity, students complete addition, multiplication, division, and subtraction problems where each answer is inserted into a bar graph. Students complete 13 problems.
Curated OER
Easter Bar Graph - (E)
In this math review worksheet, students complete addition, multiplication, division, and subtraction problems where each answer is put into an Easter bar graph. Students complete 13 problems.
Curated OER
Easter Bar Graph - (D)
In this math review worksheet, students complete addition, multiplication, division, and subtraction problems where each answer is put into an Easter bar graph. Students complete 13 problems.
Curated OER
Double Bar Graphs
In this double bar graphs practice worksheet, students sharpen their problem solving skills as they solve 6 story problems.
Curated OER
Survey Says...
Young learners create and implement a school-wide survey about student body favorites! Learners record and analyze the data on a bar graph, picture graph, and line graph, and then display the data. Then, wrap it all up with a celebration...
Curated OER
Perplexing Puzzles
Elementary and middle schoolers explore scatter plots. In this graphing lesson, pupils work in small groups and use jigsaw puzzles to develop a scatter plot. Younger students may develop a bar graph.
Curated OER
Rockin' Data
Fifth graders are given the questions, "What type of music would you suggest the manager place in front of the store?". Students collect data by talking with 20 adults and create a bar graph on the computer to present the data.
Curated OER
Big Foot Bar Graph
Students explore all the different sizes of feet within their age range while exercising their graphing skills. They work in teams to survey children in their grade to gather data about the different range of shoe sizes. Each group then...
Curated OER
Bar Graph Questions
In this bar graph worksheet, students solve 10 problems in which information on a bar graph is used to calculate answers. This page is intended as an online activity, but may be completed with paper and pencil.
Curated OER
Busted Bubbles
Using the scientific method, and bubble gum, learners conduct a motivating experiment. After conducting a series of tests involving bubble gum, they graph and analyze their results. This is the type of activity everyone loves.
Curated OER
Collecting Data to Learn About the People Around You
Human graphs, anyone? Did you eat fruit today? What is your favorite costume? Have your K – 6 learners graph the responses. Early elementary grades may count and compare while upper grades compare responses of different groups or make...
Curated OER
Forest Life- Wood Bug Study
Examine wood bugs and their habitat. Learners gather wood bugs and examine their bodies. Then discuss their body parts and how they help them survive. They also predict where they think wood bugs live to then graph the class results.
Curated OER
Making A Horizontal Bar Graph
In this bar graph worksheet, students create a bar graph to display 6 scores from basketball games. Students will label the x and y axis and correctly plot the scores from the table provided.
David Pleacher
Candy Math Fun
Few things can motivate children to learn like the promise of a sweet and tasty treat. Given a bag of M&M®s, Skittles®, or other colorful candy, students first predict the contents of the bag before counting the pieces, creating a...
Other popular searches
- Skittles Bar Graph
- Double Bar Graphs
- Bar Graphs Pictographs
- Histogram and Bar Graph
- Bar Graphs and Histograms
- Bar Graph Problem Solving
- Favorite Food Bar Graph
- Bar Graphs Histograms
- Interpreting Bar Graphs
- Bar Graphs for Birthdays
- Bar Graph Worksheet
- Bar Graphs and Charts


