Curated OER
Double Bar Graphs - Homework 7.1
Your learners have seen basic bar graphs, but do they have experience reading double bar graphs? This worksheet details how to draw a double bar graph and provides an example with six accompanying questions. The final question asks...
Curated OER
Double Bar Graphs - Practice 7.1
In this double bar graph learning exercise, students make a double bar graph from given information, then solve related problems in addition to 2 test prep problems. Houghton Mifflin text referenced.
Curated OER
Drug Sales Soar: Bar Graph
In this graphs worksheet, students analyze a bar graph that shows retail prescription drug sales in the U.S. Students complete five problem solving questions about the data on the graph.
Math Mammoth
Word Problems
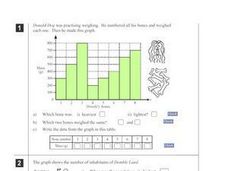
Upper grade and middle school learners problem solve and calculate the answers to twenty various word problems involving multiplication, and a bar graph.
Curated OER
Use a Graph
Information is often presented in graph form. Can your youngsters read a basic bar or picture graph? Six word problems accompany three graphs. One graph is a bar graph and the other two are pictographs.
Curated OER
Choose a Graph to Display Data
In this math graphs worksheet, students write line plot, tally chart, pictograph, or bar graph to tell the best kind of graph to use to answer the six questions.
Curated OER
Usage and Interpretation of Graphs
Cooperative groups are formed for this graphing activity. Each group must construct a graph that represents how many eyelets (the holes for laces in shoes), are present in their group. A whole-class bar graph is eventually constructed...
Curated OER
Problem Solving: Use a Graph: Problem Solving
In this bar graph worksheet, students read the word problem and use the bar graph to complete the problem solving questions for understand, plan, solve, and look back.
Curated OER
Data Handling: Bar Chart Showing Frequency
In this bar graph worksheet, learners analyze a bar graph showing soccer goals scored. Students then use the data to solve 7 problems.
Curated OER
Cutting Expenses
Students explore budgeting. In this finance and math lesson, students brainstorm ways in which households could save money. Students view websites that give cost reducing ideas. Students complete an expense comparison chart and use the...
Curated OER
Choose an Appropriate Graph
In this graphs worksheet, students solve 6 fill in the blank problems where they choose the most appropriate type of graph for each set of data and explain why they chose that type. Students use bar graphs, histograms and circle graphs....
Curated OER
Graphing
Students collect data to create different types of graphs-line, pie, and bar graphs. They use StarOffice 6.0 to create graphs.
Curated OER
Build A Skittles Graph
Students explore graphing. In this graphing lesson, students sort Skittles candies and use the color groups to create a bar graph. Rubrics and extension activities are provided.
Curated OER
Raising the Bar While Hogging the Ham (Radio, That Is)
Young scholars watch a Cyberchase video to determine the importance of using the correct scale when making bar graphs. They examine how to use bar graphs to gain information easily. They determine how to use bar graphs persuasively.
Curated OER
Graphing With Candy
Students gather information and interpret the results using a tally chart, a table, and a bar graph.
Curated OER
Double Bar Graphs
In this double bar graphs practice worksheet, students sharpen their problem solving skills as they solve 6 story problems.
Curated OER
Apple Logic and Problem Solving
Students examine apple production in the United States. In this interdisciplinary instructional activity, students use problem solving strategies introduced to solve math problems associated with apple production in the United States....
Curated OER
Bar Graph Questions
In this bar graph worksheet, students solve 10 problems in which information on a bar graph is used to calculate answers. This page is intended as an online activity, but may be completed with paper and pencil.
Curated OER
Leveled Problem Solving: Histograms
In this using data, frequency table, and histogram to solve word problems worksheet, students solve problems about prices of toys and numbers of toys sold to solve consumer mathematics problems. Students solve six problems.
Mathed Up!
Tallys and Charts
After watching a brief instructional video, young mathematicians are put to the test. By completing and reading frequency tables, tally charts, and bar graphs, individuals show their understanding of how to interpret data.
Curated OER
Usage and Interpretation of Graphs
Students explore graphing. In this graphing lesson, students predict how many shoe eyelets are present in the classroom. Students count eyelets and work in groups to organize and chart the data collected. Students put all the data...
Illustrative Mathematics
Chocolate Bar Sales
In this real-world example, algebra learners start to get a sense of how to represent the relationship between two variables in different ways. They start by looking at a partial table of values that define a linear relationship. They...
Curated OER
Get Your Pupils Moving While Learning
Use these teaching strategies to get the wiggles out and keep the learning in!
Curated OER
Data Handling: Bus Charts
In this data display and analysis worksheet, students study a bar graph that shows the number of people who ride the bus at different times of day. Students use the graph to solve 6 problems. Note: Bus times are shown in 24 hour clock time.


