Curated OER
Histograms
In this histograms learning exercise, students solve 5 word problems based on a histogram of presidential ages at their inauguration. Next, students create a frequency table and a histogram based on a list of data which shows the average...
Curated OER
A Thanksgiving Survey
Students take a survey then use the information gained from the survey to help plan a typical Thanksgiving dinner for our last day of class. They create a graph which corresponds the the data gathered during interviews.
Curated OER
Skittles, Taste the Rainbow
Fifth graders learn and then demonstrate their knowledge of a bar and a circle graph using the classroom data. Students are given a pack of skittles candy. Students create a bar and circle graph indicating the results of the contents of...
Curated OER
Local Traffic Survey
Students conduct a traffic survey and interpret their data and use graphs and charts to display their results.
Oddrobo Software
King of Math Junior
Do your students have what it takes to be the king of math? Find out with this fun skills practice game that covers a wide range of topics from counting and basic operations to measurement and fractions.
Curated OER
Graphs Abound
Young scholars create a survey for their classmates to collect data on their favorite foods, eye color, pets or other categorical data. They compile the data from the survey in a table and then make a bar graph of each category using a...
Curated OER
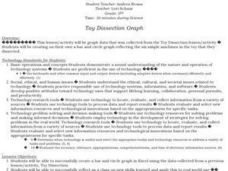
Toy Dissection Graph
Students explore simple machines and how they are made. They examine the parts of the simple machine and collect information about its parts. Using Excel, students create circle and bar graphs from the collected data.
Curated OER
What's Your Line?
Fifth graders collect temperature readings over a period of time, enter the information into a spreadsheet and choose the appropriate graph to display the results.
Curated OER
Water: From Neglect to Respect
The goal of this collection of lessons is to make middle schoolers more aware of the ways in which they are dependent upon water to maintain their standard of living. Learners compare water use in Lesotho to water use in the United...
Curated OER
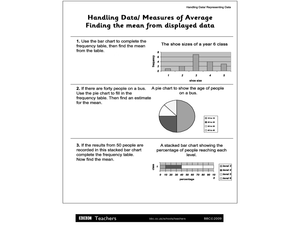
Handling Data/Measures of Average - Finding the Mean from Displayed Data
In this mean and average worksheet, students use the bars and charts to help them find the means using the given data. Students solve 3 problems.
Curated OER
Living in the Desert
Conduct an investigation on the plants used by the Hohokam tribe. To survive in the harsh desert environment the Hohokam used many natural resources. Learners read, research, map, and graph multiple aspects of Hohokam plant use as a...
Curated OER
More Bait for Your Buck!
Learners determine where to buy the heaviest earthworms as they study invertebrates. They create a double bar graph of the results of the weight data.
Curated OER
Party Time
Students design a budget to plan for a class party. In this problem solving lesson, students devise a budget with a limit of fifty dollars for a class party. Students discuss and estimate the amount of money needed for food and decorations.
UAF Geophysical Institute
Observing the Weather
How can you predict the weather without any technology? Young scientists learn to forecast the weather using traditional Native American techniques. Based on their observations of the weather, as well as talking to their classmates, they...
Curated OER
Opening the Case
Students participate in a class survey and then design an experiment and use graphs and statistics to assist them in solving a problem. They organize the results of the survey in a stem-and-leaf plot and find the range, median, mean, and...
Curated OER
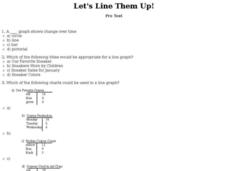
Let's Line Them Up!
In this line graph activity, students read through the problems about graphing and line graphs. Students select the best answer to solve the 10 online questions.
Curated OER
Histograms: Homework
In this histograms worksheet, students learn how to make a histogram. Students give graphs a title, draw the axes, label the vertical axis, choose an appropriate scale, and mark equal intervals. Students label the horizontal axis with...
Curated OER
Mars Landing Site
Students, through the use of candy bars at room temperature, explore the problems selecting a landing site on Mars.
Curated OER
Fly Away With Averages
Pupils discover the process of finding the mean, median, and mode. Through guided practice and problem solving activities, they use a computer program to input data and create a graph. Graph data is used to calculate the mean, median,...
Curated OER
What is a Tropical Rainforest?
Students investigate amounts of rainfall in selected world rainforests by creating a bar graph showing rainfall in inches for each. They convert inches to millimeters, and solve word problems having to do with rainfall in selected world...
Alabama Learning Exchange
Poppin' For Popcorn!
Students graph data from different popcorn flavors. In this graphing lesson, students make graphs using an assigned web site after collecting data about the flavors of popcorn that fellow classmates prefer.
Curated OER
Butterfly Adventure
Students in second grade are paired with fifth grade computer research buddies. They observe the characteristics of caterpillars, and identify the four stages of the caterpillar to butterfly life cycle. They graph the number of...
Curated OER
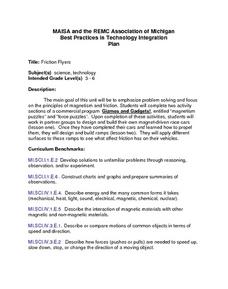
Friction Flyers
Students explore the principles of magnetism and friction. They complete an interactive puzzle on the Gizmos and Gadgets computer software, construct a vehicle, build and modify ramps and vehicles to produce various outcomes, and...
Curated OER
What Would Make Our School More "Green"?
Students survey their school to get ideas for how to make the school more environmentally friendly. In this environmental lesson, students collect data from other students and teachers. They use the data to create graphs and present a...


