Living Rainforest
Finding the Rainforests
From Brazil to Indonesia, young scientists investigate the geography and climate of the world's tropical rain forests with this collection of worksheets.
Curated OER
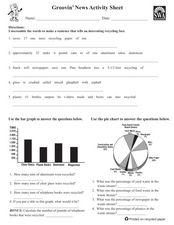
Groovin' News Activity Sheet
In these recycling worksheets, students complete several activities to learn about recycling. Students complete a word search, word scramble, bar graph, pie chart, research project, class project, and individual project for recycling.
Curated OER
Interpreting Graphs: Temperate Climates
In this interpreting graphs activity, students read a graph containing data of rainfall and temperature, then complete 18 questions, interpreting the data.
Curated OER
Using Data To Make Graphs
In this using data to make graphs worksheet, learners interactively answer 10 multiple choice questions then click to check their answers.
Curated OER
Fractions of Whole Numbers 1
For this math worksheet, students use line graphs and fraction bars to multiply fractions and whole numbers. The fraction is represented on the line graph and the whole number on the fraction bar.
Curated OER
Data Handling
In this data handling worksheet, 6th graders solve and complete 4 various types of problems. First, they draw a bar chart to represent the information provided in the table shown. Then, students show beneath the table how to work out the...
Curated OER
An Inventory of My Traits
In this biology activity, students identify and describe a number of easily observable genetic traits and compare the traits they have with other students. Then they identify and describe that some traits are common while others are not...
Curated OER
Pictures of Data: Post Test
In this data learning exercise, students answer multiple choice questions about charts and graphs. Students answer 10 questions total.
Curated OER
Where Did We Go on Holiday This Year?
In this differentiated whole-group activity worksheet, students list all the places they visited over the summer, record the places on a flip chart, calculate the distances on a road map and graph the data they collect.
Curated OER
Let's Graph It
In this let's graph it worksheet, student interactively answer 10 multiple choice questions about graphing data and types of graphs, then click to check their answers.
Curated OER
Problem-Solving Application: Use a Graph
In this problem solving worksheet, 6th graders use the problem solving steps of understand, plan, solve and look back to answer a graphing question.
Curated OER
M&M’s Math Worksheet
Who knew you could cover prediction, histograms, fractions, decimals, data collection, and averages (mean, median, and mode) all with a bag of M&M's®? Here's a fantastic set of worksheets to help you make candy a mathematical journey...
Curated OER
Como llegas a la escuela?
What is the most popular way to get to school? Have students interview their peers to discover how and when they get to school. Then learners will graph the results. Consider providing statistics from other classes for your older...
Curated OER
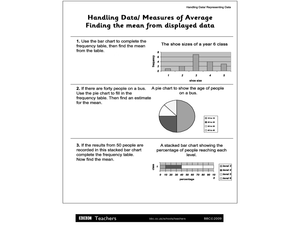
Handling Data/Measures of Average - Finding the Mean from Displayed Data
In this mean and average worksheet, students use the bars and charts to help them find the means using the given data. Students solve 3 problems.
Los Angeles County Office of Education
Assessment For The California Mathematics Standards Grade 6
Test your scholars' knowledge of a multitude of concepts with an assessment aligned to the California math standards. Using the exam, class members show what they know about the four operations, positive and negative numbers, statistics...
Curated OER
Viruses: Tiny But Deadly
In this viruses worksheet, students read given information about the effect of viruses on people throughout history. Students create a bar graph comparing the viruses and answer seven questions based on the information they have learned.
Curated OER
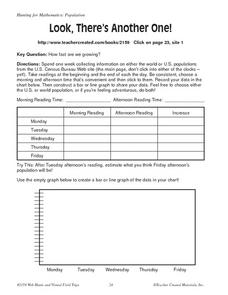
Look, There's Another One!
In this math worksheet, learners spend a week collecting information on either the word or U.S. populations from the U.S. Census Bureau Web site. Students record their data in a chart and bar graph. Learners also use the website to...
Curated OER
Comparing And Ordering Decimals
In this decimals worksheet, students compare and order decimals using comparing symbols, ordering from least to greatest, answering word problems, and deciphering a bar graph. A very nice resource.
Curated OER
Rainforest Data
For this geography worksheet, students use the climate data given to create a temperature line graph and rainfall bar graph for each of three locations given. Then they use an atlas to compare their graphs and draw conclusions about the...
Noyce Foundation
Ducklings
The class gets their mean and median all in a row with an assessment task that uses a population of ducklings to work with data displays and measures of central tendency. Pupils create a frequency chart and calculate the mean and median....
Curated OER
Impact Craters Activity
Lunar explorers perform an experiment to understand the size of the craters on the surface of the moon. They layer flour, laundry detergent, and cocoa powder in a pan to model the lunar surface. They drop marbles from different heights...
Curated OER
Chances Are...
In this math instructional activity, students perform 2 math investigations pertaining to probability--flipping pennies and rolling dice. Students record on the instructional activity the results of each attempt, then graph the results....
Curated OER
Heat: The Transfer of Thermal Energy
In this heat learning exercise, students complete experiments with heat and answer short answer questions about the transfer of thermal energy. Students complete 4 questions, one chart, and one bar graph.
Curated OER
More Students Taking Online Courses
In this graph worksheet, students study a bar graph that shows the number of college students taking at least one online course. Students answer 4 problem solving questions about the data on the graph.
Other popular searches
- Skittles Bar Graph
- Double Bar Graphs
- Bar Graphs Pictographs
- Histogram and Bar Graph
- Bar Graphs and Histograms
- Bar Graph Problem Solving
- Favorite Food Bar Graph
- Bar Graphs Histograms
- Interpreting Bar Graphs
- Bar Graphs for Birthdays
- Bar Graph Worksheet
- Bar Graphs and Charts


