Curated OER
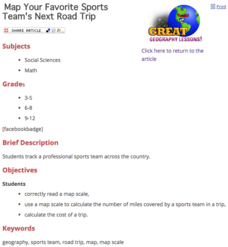
Map Your Favorite Sports Team's Next Road Trip
Students track a sports team across the country. They use a map scale to calculate the number of miles traveled by their sports team on a trip, conduct Internet research, and calculate how much it would cost them to go along on the trip.
Mathematics Assessment Project
Designing a 3d Product in 2d: a Sports Bag
Sew up pupil interest with an engaging, hands-on lesson. Learners first design a sports bag given constraints on the dimensions of fabric. They then evaluate provided sample responses to identify strengths and weaknesses of included...
Curated OER
Sports Teams & Math
Students collect sports data, keep track of wiins, losses and scores and average the teams' scores.
Curated OER
Comparison of Two Different Gender Sports Teams - Part 1 of 3 Measures of Central Tendency
Students gather and analyze data from sports teams. In this measures of central tendency lesson plan, students gather information from websites about sports team performance. Students analyze and draw conclusions from this data. This...
Curated OER
Sports and Hobby Math
Explore math concepts as they relate to real world situations. Young analysts consider a personal hobby or favorite sport and list three ways math is involved in the hobby. They create several related math story problems and write a...
Curated OER
comparison of Two Gender Sports Teams
Young scholars gather data on sports team and create a box and whisper plot. In this data collection lesson, students find the median, the quartile range, and relationships between variables.
Curated OER
Comparison of Two Different Gender Sports Teams - Part 3 of 3 Scatter Plots and Lines of Best Fit
Students create a scatter plot for bivariate data and find the trend line to describe the correlation for the sports teams. In this scatter plot lesson, students analyze data, make predictions,and use observations about sports data...
Curated OER
Fantasy Baseball Team
Students create a database and use its ability to store, sort, and present information about their fantasy baseball team. They gather information and use their knowledge of statistics to accomplish their team.
Illustrative Mathematics
Offensive Linemen
Comparing college football teams, Division I is said to have heavier lineman than Division III. Your mathematicians are given data from two different divisions and will have to interpret a dotplot and calculate the difference in weight...
Curated OER
College Athletes
When more basketball players are taller than field hockey players at a school, is it safe to say that in general they are always taller? The activity takes data from two college teams and your learners will be able to answer questions...
Region of Peel
Put Me in Order
Sorting fractions, integers, decimals and square roots into sequential order is an active process when you use a gym as your setting. After your class is divided into two groups and provided with number cards, they compete to see who can...
Curated OER
Frisbee Baseball
Students keep track of the number of tosses it takes them to reach each base, and encourage team members and recognize their successes. To make this activity fit the level of older classes, measure distances and figure averages as you play!
Virginia Department of Education
Organizing Topic: Data Analysis
Learners engage in six activities to lead them through the process of conducting a thorough analysis of data. Pupils work with calculating standard deviations and z-scores, finding the area under a normal curve, and sampling techniques....
Curated OER
Shooting Stats
Eighth graders discover the important role statistics play in sports and that appropriate data must be collected to do a statistical analysis. Students practice calculating statistics by charting a professional player of their choice.
Curated OER
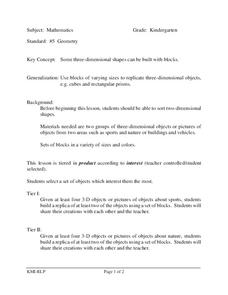
Geometry
Students build replicas about nature and sports. In this geometry lesson plan, students build 3D replicas of nature and sports objects in teams.
PBS
Snowboarding Women Making History: Winter Sports, Gender Roles in Sports, Biographies
Students will explore biographical Web pages about women who are competing in snowboarding. They will compare and contrast the experiences of these women, and design interview questions to be submitted via email.
Curated OER
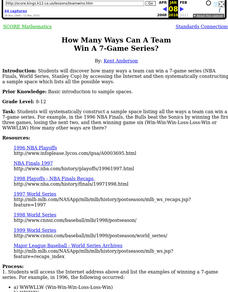
How Many Ways Can A Team Win A 7-Game Series?
Students discover how many ways a team can win a 7-game series (NBA Finals, World Series, Stanley Cup) by accessing the Internet. They view sites that cover a variety of sports.
Curated OER
NUMB3RS - Season 2 - "Convergence" - Air Hockey
Learn how to use a matrix to organize data to solve a problem. This activity uses wins and losses to rank players for an air hockey tournament they wish to have. After practicing some basic matrix operations the class could do the...
Curated OER
Get Ready For Some Football
Sixth graders compare and contrast the totals from two national football teams for the year. Using the internet, they search for the information they need and create a data bar graph. They use the information they collected to answer...
Curated OER
SOS: Save Our Ski Slopes
Pupils defend downhill skiing as an Olympic Games event by creating a presentation that graphically proves the economic impact and popularity of this event.
Curated OER
Make That Shot!
Young scholars figure out basic percentages by shooting paper balls into a basket, recording results, and calculating individual and team percentages for ten shots.
Curated OER
Bouncing off the Wall
Learners watch a video clips before problem solving the use of angles in real world situations. They problem solve using spatial reasoning while connecting math to a sports activity that investigates the path of a bouncing ball.
Curated OER
Statistics Newscast in Math Class
Students study sports teams, gather data about the teams, and create a newscast about their data. In this sports analysis lesson, students research two teams and define their statistical data. Students compare the two teams, make...
Curated OER
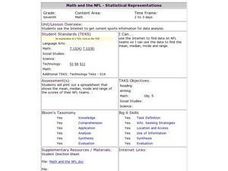
Math and the NFL - Statistical Representations
Seventh graders use the Internet to get current sports information for data analysis. They use their data to find the mean, median, mode and range. Students then place their data on a spreadsheet.
Other popular searches
- Types of Team Sports
- Team Sports Lesson Plans
- Team Sports Fitness
- Kinds of Team Sports
- Sports Team
- Elementary Team Sports
- Phys Ed Team Sports
- Team Sports Pe
- Sports Team Challenges
- Sports Team of Montana
- Initiation to Team Sports
- Sports Team Mascots


