Curated OER
Review Graphing Parabolas & Circles
Students review how to graph parabolas. They practice graphing two different parabolas using the vertex and table method. They solve problems related to graphing circles, determining the radius and the center.
DK Publishing
Using Information in Tables
Find out how well can your second or third graders use tables to solve word problems by assigning this single-page worksheet. Two tables with different sets of data prompt learners to solve six problems. An example at the top of the page...
Curated OER
Which Fish Where?
Here is a lesson outline that prompts elementary students to graph and analyze data regarding fish caught along the Hudson River. They will review vocabulary and complete 2 worksheets which can be accessed by clicking on the provided links.
Curated OER
Slope & Intercepts
In this slope and intercepts worksheet, 9th graders solve and graph 6 different problems that include responding to questions in reference to each equation. First, they complete the table and graph by solving each equation. Then,...
Curated OER
Unit 6b -Year 5
If you have some 9-10 year olds who are ready for some 5th year math, then check out this UK math unit. There are 172 slides that cover all of the basic multiplication tables, relate those to division, fractions, sequencing, and an...
Curated OER
Comparing Data on Graph A and Graph B
Second graders gather and graph data. In this graphing lesson, 2nd graders collect data and graph this information using tally charts, bar graphs, pictographs, or tables. They make predictions about the outcomes.
Curated OER
Shaquille O'Neal Hand & Foot Span
If Shaquille O'Neal wears a size-20 shoe, how big are his hands? Learners will use the average ratios of foot length to hand span to calculate the hand span of Shaq, but first, they have to collect the data! They will measure their peers...
Curated OER
Measuring & Graphing Motion
Fifth graders study how to measure distance. In this graphing motion lesson students complete a lab activity that shows them on the computer how to make graphs.
Curated OER
Many Ways to Represent Our Data
Demonstrate several ways to represent data with your class. They will use surveys to gather data and display the data using tally charts and graphs. Then answer questions according to the data.
Curated OER
Range, Cluster, Gap and Outliers
There are a number of activities here where learners collect and record data, as well as, activities where the likelihood of an event happening is calculated given the experimental probability. Young statisticians organize information...
Curated OER
Graphs Review
Seventh graders review different types of graphs such as bar graphs, line graphs, box & whisker plots. As a class, they read a story and construct graphs to solve the data in the story. Students play "Graph Jeopardy" which requires...
Curated OER
Topic 3.5 & 3.6: Linear Programming
In this linear programming worksheet, students define variables and write a system of inequalities for the given situation. They model the solution through graphing. This two-page worksheet contains six multi-step word problems.
Curated OER
Walking on Air
Students collect and analyze data with a graph. In this statistics lesson, students use central tendencies to find the meaning of their data. They display the data on a Ti calculator.
Curated OER
Impact!!
Students perform a science experiment. In this algebra lesson, students collect data from their experiment and create a graph. They analyze the graph and draw conclusion.
Curated OER
Functions & Algebra
Young scholars examine linear equations. In this functions and algebra lesson, students write equations in the slope-intercept form. They enter data in a graphing calculator, examine tables, and write linear equations to match the data.
Discovery Education
Sonar & Echolocation
A well-designed, comprehensive, and attractive slide show supports direct instruction on how sonar and echolocation work. Contained within the slides are links to interactive websites and instructions for using apps on a mobile device to...
Curated OER
Measurement: Stream Flow & Stadium Capacity
Eighth graders study the scientific fields and how information can be monitored and recorded. In this scientific inquiry lesson plan students view a PowerPoint presentation and complete a hands on activity.
Curated OER
What's Your Favorite Fruit?
A sweet activity to challenge your first graders! The picture graph displays a class's favorite fruits. Young learners solve various problems with the data, including counting the amounts of each kind of fruit, and interpreting which...
G. Turrell
Science Activity 1: Light & Sound
Are you looking for lab sheets to go with your class experiment on plant response to light? You are no longer in the dark! This is a lesson that was written for a unit on light, but could easily be used to demonstrate plant behaviors in...
Curated OER
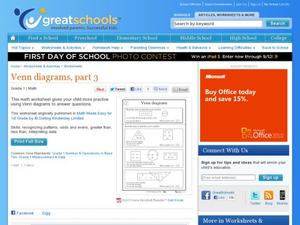
Venn Diagrams, Part 3
Can your first graders interpret Venn diagrams? Different sets of clues help pupils narrow down a specific number in different shapes. They determine odds and evens, greater than or less than, and what shape the number is in. A fun...
Curated OER
M & Ms in a Bag
Students make predictions about the number and colors of M&M's in a snack size package. They create an Excel spreadsheet to record the data from their small group's bag, create a graph of the data, and discuss the variations of data...
State of Michigan
Pre-K Mathematics
Kick-start children's education with this pre-school math unit. Offering 31 different hands-on learning activities that develop young mathematicians' pattern and shape recognition, basic number sense, and much more, this is a must-have...
Curated OER
Understanding Groundwater & the Effects of Pollution
Students complete a unit on the effects of pollution on our water supply. They create a graph to examine the density of earth's land surface, round the population to the nearest hundred million place, participate in a...
Curated OER
Bungee M&M's
Science is exciting - and delicious! Pairs of learners set up a bungee cord type of experiment. They use buckets filled with M & M's, a meter stick, and a Slinky spring (as the bungee) to conduct their experiment. A good activity...


