Wordpress
Equation Table Graph
Your Algebra learners will appreciate this fabulous, two-page printable. The first page has a list of numbers that lead to the learners writing an equation in a cloud that represents these numbers, and then filling in a table, and...
EngageNY
The Structure of Ratio Tables—Additive and Multiplicative
Build tables by understanding their structure. Scholars take a closer look at the structure of ratio tables in the 10th segment in a 29-part series. Individuals realize that the tables can be built using an additive or multiplicative...
Mathed Up!
Two Way Tables
When presented with categorical data, a two-way frequency table is a great way to summarize the information. Pupils organize categorical data using a two-way table, then use the tables to determine missing data and to calculate simple...
Curated OER
Chairs Around the Table
Youngsters become flexible problem solvers with this challenging instructional activity. If there are 24 square tables in a restaurant, how many customers can be seated at one time? They can use manipulatives or draw pictures to help...
Curated OER
Reading Tables
Who is two years younger than Meg? Who is older than Paul, but not Kinta? Scholars practice reading tables as they answer comprehension questions based on three sets of data. First, they examine a table depicting ages, then favorite...
CPM
Tables, Equations, and Graphs
Eighth and ninth graders solve and graph 24 different problems that include completing input/output tables and graphing the pairs. First, they find the missing values for each table and write the rule for x. Then, students write the...
Curated OER
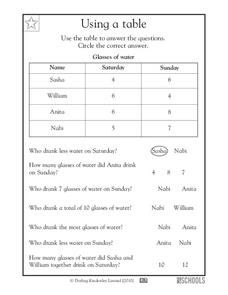
Using a Table
Tables are no help if your scholars can't read them; provide some excellent beginner-practice using this table example and accompanying comprehension questions. Learners examine the data first, which charts the number of glasses of water...
Curated OER
Tables
Can you read this table? Learners begin to comprehend data analysis through examining two simple tables and answering comprehension questions. The first gives characteristics about three animals in yes-or-no format (i.e. "eats insects,"...
Curated OER
Tables and Graphs
Help pupils read graphs and tables with these examples and data comprehension questions. First they examine a bar graph to answer five analysis prompts. Note this graph doesn't have a label along the y-axis, so you may want to do this...
Scholastic
Study Jams! Function Tables
Each week Mia saves a certain portion of the earnings from her babysitting job. Help her figure out how much she can save this week with a step-by-step presentation on function tables. Given a set of inputs and outputs, the process for...
Curated OER
Graphing Linear Equations Using a Table of Values
Students explore the concept of linear equations. In this linear equations worksheet, students graph linear equations using tables of values. Students graph 16 linear equations.
Corbett Maths
Medians and Quartiles from Grouped Frequency Tables and Histograms
Determine medians within a group. Given data represented as a frequency table of grouped data, the video demonstrates finding an estimation for the median. After finding the group where the median resides, the presenter uses a formula to...
CK-12 Foundation
Frequency Tables to Organize and Display Data: Favorite Films
What information can your class determine if they know the number of people attending movie showings? Using the information about the number of people at each screening, learners develop a frequency table. The pupils analyze the type of...
Flipped Math
Frequency Tables
What's the association? Pupils watch a presentation on creating a two-way frequency table. Learners find out how to calculate relative frequencies within the table to determine whether there is an association between the two categories....
Curated OER
Reading Time Tables
What time does the bus get to State Street? The only way to find out, is to read a handy time-table, or bus schedule. This presentation provides ample practice to get learners ready to catch any mode of transportation on time. A great...
EngageNY
Tables of Equivalent Ratios
Don't table the discussion on equivalent ratios — do it now! Scholars create tables of equivalent ratios to represent contextual problems. Pupils go on to use the tables to answer questions within the context. The activity is ninth in a...
EngageNY
Comparing Ratios Using Ratio Tables
Decide which concentration of mixtures is the strongest. Pupils use tables to compare ratios involved in mixtures. They use two methods to make the comparisons — by finding equivalent values within the tables or by comparing the values...
EngageNY
Summarizing Bivariate Categorical Data in a Two-Way Table
Be sure to look both ways when making a two-way table. In the lesson, scholars learn to create two-way tables to display bivariate data. They calculate relative frequencies to answer questions of interest in the 14th part of the series.
EngageNY
From Ratio Tables to Double Number Line Diagrams
How much sugar is in one bottle? Pupils use double number line diagrams to determine the amount of sugar in a 1L bottle of cola. The teacher leads a discussion on ways that double number lines can be of assistance in solving a problem...
CK-12 Foundation
Function Rules for Input-Output Tables: Soda Sugar Function Table
Examine the relationship between the input and output variables in a table of values. As learners build an input-output table using online manipulatives, they begin to identify patterns. They answer questions about these patterns and...
Charleston School District
Two-Way Tables
Do males or females buy more iPhones? Using a two-way frequency table can help to answer this question. Pupils learn to create two-way frequency tables and then how to analyze the data within the tables. Learners find frequencies,...
5280 Math
Multiplication Table Algebra
Patterns, patterns, everywhere! Young scholars examine the multiplication table to identify patterns. Their exploration leads to an understanding of the difference of squares and sum of cubes by the completion of the algebra project.
Corbett Maths
Median for a Frequency Table
Try to find the middle of a frequency table. Using a frequency table of ages, the video shows how to use a formula to determine the position of the median. The resource uses frequency tables with both even and odd numbers of data points.
Curated OER
Frequency Tables - Home Link Support
In this home school support worksheet, 2nd graders, with a home support person, review the use of frequency tables to organize and display data. They make their own frequency table and read it with the support person.
Other popular searches
- Periodic Table
- Multiplication Tables
- Math Tables and Tools
- Function Tables
- Chemistry Periodic Table
- Periodic Table of Elements
- Table of Contents
- Input/output Tables
- Multiplication Tables 1 100
- Frequency Tables
- Input Output Tables
- Data Table


