Curated OER
Using Mathematics to Explain the Spread of Diseases
Students use statistics to solve problems based on the spread of disease. In this disease lesson plan students study the role that viruses and bacteria play in the spread of diseases and explain pandemics.
Curated OER
Iraq In-Depth
Students examine public opinion about the war in Iraq. They read and discuss an article, participate in a poll, analyze statistics, create annotated scales demonstrating their findings, and write a reaction paper.
Curated OER
The Mathematical Implications of Lying
Students explore how statistics can be interpreted in different ways. In this probability lesson students complete a class lab activity then discuss their findings.
Curated OER
Involving Community Members, Parents, and Community Agencies in Student Learning
Students predict and estimate the number of moose shot by people between the years of 1986-1990. They analyze data and statistics, construct bar graphs, and conduct research on the Alaskan moose.
Curated OER
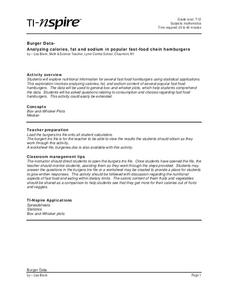
Box-and-Whisker Plots
High schoolers explore nutritional information for several fast food hamburgers using statistical applications. In this statistics lesson, students analyze calories, fat, and sodium content of various fast food restaurants. High...
Curated OER
Cell Phones Create Dangers
Young scholars research what laws, if any, relate to cell phones in your state and community. Students interview local law enforcement personnel to find out if cell phones have caused accidents in your town or city. Try to get statistics...
Curated OER
Deadly Desires
A lesson on STD's captures learners with shocking statistics. Small groups create informational brochures on specific STD's, which they will present to the class. The links for research are overall excellent, but should be previewed for...
Curated OER
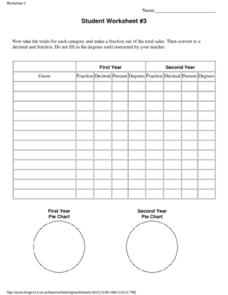
Genre Sales Statistics Percent Worksheet
In this literacy worksheet, students use the context of music genre sales in order to practice the skills of decimal and percentage conversion.
Curated OER
Math: Football League Statistics
Young scholars examine a soccer league final standings chart and then answer 12 questions based on the information provided. They calculate some answers in both fractions and percentages.
Curated OER
A RealSim Surface Look at Descriptive Statistics
Learners explore the concepts of mean and variance. They observe properties of materials to their basic atomic or molecular structure. Students use spreadsheet software to record, tabulate and analyze collected information.
Curated OER
Correlation and Regression
In this statistics workshop students find the value of linear correlation coefficients in three situations. Students find equations of the regression lines for 4 problems.
Curated OER
Graphs: All About Our Class
Students respond to survey questions, discuss results, brainstorm ways to represent survey information, and create table of class results. They find mean, range, and percentages, and create graph to display results.
Statistics Education Web
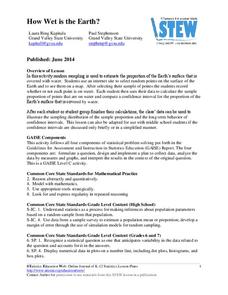
How Wet is the Earth?
Water, water, everywhere? Each pupil first uses an Internet program to select 50 random points on Earth to determine the proportion of its surface covered with water. The class then combines data to determine a more accurate estimate.
American Statistical Association
Chocolicious
To understand how biased data is misleading, learners analyze survey data and graphical representations. They use that information to design their own plans to collect information on consumer thoughts about Chocolicious cereal.
Statistics Education Web
You Will Soon Analyze Categorical Data (Classifying Fortune Cookie Fortunes)
Would you rely on a fortune cookie for advice? The lesson plan first requires future statisticians to categorize 100 fortune cookie fortunes into four types: prophecy, advice, wisdom, and misc. The lesson plan goes on to have learners...
EngageNY
Sampling Variability and the Effect of Sample Size
The 19th installment in a 25-part series builds upon the sampling from the previous unit and takes a larger sample. Pupils compare the dot plots of sample means using two different sample sizes to find which one has the better variability.
Museum of Tolerance
Why is This True?
Are wages based on race? On gender? Class members research wages for workers according to race and gender, create graphs and charts of their data, and compute differences by percentages. They then share their findings with adults and...
Virginia Department of Education
Normal Distributions
Pupils work to find probabilities by using areas under the normal curve. Groups work to calculate z-scores and solve real-world problems using the empirical rule or tables.
Statistics Education Web
It Creeps. It Crawls. Watch Out For The Blob!
How do you find the area of an irregular shape? Class members calculate the area of an irregular shape by finding the area of a random sampling of the shape. Individuals then utilize a confidence interval to improve accuracy and use a...
Curated OER
Race and Crime in the United States: Are We Victims of Discrimination or Antiheroes?
Using methods adopted by Public Policy Analysts (PPA) class groups define a social problem, gather evidence to document the existence of the problem, identify causes, evaluate existing policies designed to deal with the problem, develop...
EngageNY
Summarizing Bivariate Categorical Data
How do you summarize data that cannot be averaged? Using an exploratory method, learners complete a two-way frequency table on super powers. The subject matter builds upon 8th grade knowledge of two-way tables.
EduGAINs
Introduction to the Great Depression—Canadian and World Studies
Ah, the classic business cycle model: recession, depression, recovery, prosperity. And then there was the Great Depression. Groups investigate the economic conditions that led to and social movements of the 1920s that great out of the...
Beacon Learning Center
Line Plots
Introduce line plots, show examples of tables, graphing on a number line, and engage in a class discussion. Share the process by which statistical data is organized and displayed on a number line. Examples and worksheets are included....
EngageNY
Margin of Error When Estimating a Population Proportion (part 2)
Error does not mean something went wrong! Learners complete a problem from beginning to end using concepts developed throughout the last five lessons. They begin with a set of data, determine a population proportion, analyze their result...
Other popular searches
- Data, Census, & Statistics
- Probability and Statistics
- Educational Statistics
- Baseball Statistics
- Math Statistics
- Climate Statistics
- Math Lessons Statistics
- Median and Mean Statistics
- Statistics Lesson Plans
- Sports and Statistics
- Probability Statistics
- Black Plague Statistics


