Shodor Education Foundation
Skew Distribution
Slide the class into a skewed view. Learners alter the location of the median relative to the mean of a normal curve to create a skew distribution. They compare the curve to a histogram distribution with the same skewness.
CK-12 Foundation
Parallel and Skew Lines: Parallel or Not?
There's nothing askew about an informative resource. Pupils adjust one of two lines in an interactive to determine if the lines are parallel or skew. They answer a set of challenge questions about the lines.
EngageNY
Measuring Variability for Skewed Distributions (Interquartile Range)
Should the standard deviation be used for all distributions? Pupils know that the median is a better description of the center for skewed distributions; therefore, they will need a variability measure about the median for those...
Curated OER
Classifying Angles
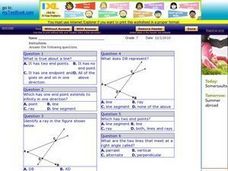
In this classifying angles activity, 10th graders solve and complete 35 various types of problems. First, they match each type of angle with its correct description. Then, students determine whether the given lines or planes are...
EngageNY
Distributions—Center, Shape, and Spread
Data starts to tell a story when it takes shape. Learners describe skewed and symmetric data. They then use the graphs to estimate mean and standard deviation.
EngageNY
Creating a Histogram
Display data over a larger interval. The fourth segment in a 22-part unit introduces histograms and plotting data within intervals to the class. Pupils create frequency tables with predefined intervals to build histograms. They describe...
Curated OER
The Bell Curve
Learners are introduced to the concepts of the normal curve, skewness and the standard deviation. They discuss how the normal distribution has been used and misused to support conclusions.
101 Questions
Class Height Distribution
A picture is worth a thousand words, and this is no exception! The introductory photo shows a group of classmates lined up in height categories; females and males are in different colors, and the shape of the curve they create is...
Curated OER
Geometry Lines and Angles
In this lines and angles worksheet, 10th graders solve and complete types of problems that include different line segments and angles to identify. First, they determine whether each line is parallel, skew, or perpendicular in the diagram...
Curated OER
Parallel Lines and Transversals
In this parallel lines and transversals worksheet, 10th graders solve nine different problems related to measuring parallel lines and transversals. First, they name two more pairs of parallel segments, two more skew segments, and two...
Curated OER
The Bell Curve
High schoolers explore the concept of the bell curve. In this bell curve lesson, students discuss the controversy associated with the bell curve. High schoolers use an applet to explore a normal distribution. Students discuss mean,...
Curated OER
Navajo Weaving: A Lesson in Math and Tradition
Combine geometry and tradition with a lesson that spotlights Navajo weaving. The book, The Goat in the Rug by Charles L. Blood and Martin Link hooks scholars before watching a video of Navajo people tending their sheep and beginning to...
CK-12 Foundation
Stem-and-Leaf Plots and Histograms: Digital Photography
Cameras use histograms to communicate the exposure of a photograph. An interesting lesson uses this idea to help learners deepen their understanding of histograms. It highlights the skew of the graphs by showing under- and overexposed...
CK-12 Foundation
Mean: Arithmetic Mean
How is a mean affected by changes in data? A well-designed animation allows individuals to manipulate data and watch the effect on the mean. Challenge questions help guide users to conclusions about outliers and skew within data.
Curated OER
Mean, Median, Mode, Range
Learners engage in a study of mean, median, mode, and range in order to represent data in tables. They are also exposed to the results of data that is skewed because of the outlier.
Curated OER
Transforming Univariate Data
Learners analyze plotted data in this statistics lesson. They differentiate between skewed and normal data. They also explore and interconnect exponential growth and decay as it relates to the data.
Curated OER
Perpendicular and Parallel Lines
In this geometry worksheet, students identify lines that are parallel, perpendicular or skew to different polygons. There are 25 questions.
Flipped Math
Lines and Angles
Develop a sense of understanding. Pupils learn eight definitions dealing with types of lines and angles formed when two lines are crossed by another line. Learners use the definitions to identify the lines and pairs of angles in figures...
Curated OER
Center and Spread
Students collect and analyze data. For this statistics lesson, students define and calculate the range, median and standard deviation. They identify reasons for a skewed distribution.
Curated OER
Normal Probability Plot
Students analyze the graph of a distribution. In this statistics lesson, students define skewed or mound shape distribution as they investigate the data behind the graph. They define and plot outlier as well as normal probability.
US Department of Commerce
Census in Counties - Describing and Comparing Histograms to Understand American Life
Use graphs to interpret life in 136 counties. Pupils analyze histograms and describe the shapes of the distributions of data collected from several counties on different aspects of life. Scholars make predictions on the difference in...
Curated OER
The Bell Curve
Pupils are introduced to the normal distribution and examine the bell curve controversy.
Curated OER
Sales Leader
Learners examine a set of data based on a realtor's sales for a specific amount of time. Using this information, they calculate the mean, mode and median and how to skew the data to different points of view. They determine which...
Virginia Department of Education
High School Mathematics Geometry Vocabulary Word Wall Cards
Having a good working knowledge of math vocabulary is especially important for geometry learners. Here are 119 pages worth of wonderfully constructed definitions, constructions, formulas, properties, theorems, and postulates. This is a...
Other popular searches
- Skew Lines
- Parallel Skew Lines
- Dispersion and Skewness
- Skew and Parallel Lines
- Geometry Skew Lines
- Skewed Statistics
- Skew Rays
- Skewer
- Angle Skew


