Utah Education Network (UEN)
Finding Slope of a Line from Graphs, Tables, and Ordered Pairs
Middle schoolers explore the concept of slope in numerous ways and start to look at simple linear equations. They describe the slope in a variety of ways such as the steepness of a line, developing a ratio, using graphs, using similar...
Curated OER
Senior Analysis: Graphing Rational Functions
Budding mathematicians graph given functions, identify the asymptotes, graph absolute values, and write a table of points. This three-page worksheet contains 23 problems.
Mathed Up!
Transformation of Graphs
In what ways can you transform a graph? An engaging video answers this question as it covers reflections, translations, and stretches of graphs. To test their knowledge, individuals complete a set of problems to apply this knowledge.
Illustrative Mathematics
Building a Quadratic Function Form
A simple tweak in the equation can mean big things for a quadratic graph. High school mathematicians look at the parent graph of a quadratic and incorporate three different changes to the function. The problems require explanations of...
Balanced Assessment
Writing and Sketching Resource
Picture this—the class creates pictures using functions. Here, learners build functions to model specific graphic criteria. They use their knowledge of parent functions and transformations to create the perfect function.
Curated OER
Graphing Lines in Slope-Intercept Form
Put it in slope-intercept form! Learners solve linear equations and sketch a graph of the equation on a coordinate plane. This instructional activity contains 12 problems and an answer key.
Curated OER
Worksheet 9: Trig Functions
In this math worksheet, students are given 7 problems in which they write expressions for trig functions, compute limits and graph functions.
Curated OER
IB Math SL 1 - Transformations and Combinations Worksheet
Study transformations and combinations with your advanced math class. They solve four graphing problems by graphing the transformations of a parent graph. They determine the equations to represent the given transformations of a parent...
EngageNY
Graphing Cubic, Square Root, and Cube Root Functions
Is there a relationship between powers and roots? Here is a lesson that asks individuals to examine the graphical relationship. Pupils create a table of values and then graph a square root and quadratic equation. They repeat the process...
Curated OER
Call it "Macaroni"
Who knew there were so many fun educational opportunities featuring pasta? Scholars read a brief informational text about the history of pasta (note that "macaroni" is spelled two different ways, so address this if kids are reading...
Flipped Math
Unit 2 Review: Polynomial Functions
Wrap it all up in a box. Pupils review the key concepts from an Algebra 2 polynomial functions unit by working 19 problems. Problems range from using the Remainder Theorem to find remainders and finding factors; sketching graphs by...
Curated OER
Exploring Slope and Intercept
In this slope and intercept worksheet, students complete 23 problems involving sketching graphs, interpreting graphs, and interpreting slope.
Curated OER
Graphing Linear Inequalities
In this graphing worksheet, students solve and graph linear inequalities on a coordinate plane. Inequalities contain one variable. The solution set is sketched and colored. This worksheet contains eight problems on two pages, with an...
Curated OER
Graphing Lines
In this graphing lines worksheet, students graph lines that are in the point-slope form. They identify the y-intercept and the slope. They graph the equation of a line on a coordinate plane. This four-page worksheet contains 12...
Curated OER
Graphing and Properties of Hyperbolas
In this graphing and properties worksheet, students identify the vertices, foci of each hyperbola. They graph hyperbolas. Students identify asymptotes, the length of the transverse axis and the length of the conjugate axis. This...
Curated OER
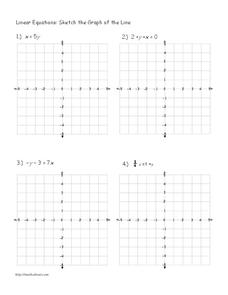
Linear Equations: Sketch the Graph of the Line
In this linear equations worksheet, 6th graders complete 4 problems, sketching the graphs of lines of equations. A reference web site is given for additional activities.
Curated OER
Worksheet 3: Graphing Speed and Time
In this graphing speed and time worksheet, students answer 7 questions regarding graphing, speed, distance, derivatives, Newton's method and wheel radius.
EngageNY
Graphs of Exponential Functions
What does an exponential pattern look like in real life? After viewing a video of the population growth of bacteria, learners use the real-life scenario to collect data and graph the result. Their conclusion should be a new type of graph...
Inside Mathematics
Sorting Functions
Graph A goes with equation C, but table B. The short assessment task requires class members to match graphs with their corresponding tables, equations, and verbalized rules. Pupils then provide explanations on the process they used to...
EngageNY
Translating Graphs of Functions
If you know one, you know them all! Parent functions all handle translations the same. This lesson examines the quadratic, absolute value, and square root functions. Pupils discover the similarities in the behavior of the graphs when...
Illustrative Mathematics
Transforming the graph of a function
This activity guides learners through an exploration of common transformations of the graph of a function. Given the graph of a function f(x), students generate the graphs of f(x + c), f(x) + c, and cf(x) for specific values of c. The...
Agile Mind
Transforming Graphs of Quadratic Functions
In the activity on this webpage, learners use interactive graphing technology to investigate transformations of graphs. In the first part of the task, they look at the graph of a quadratic function with coordinates of a few points...
EngageNY
Systems of Equations
What do you get when you cross a circle and a line? One, two, or maybe no solutions! Teach learners to find solutions of quadratic and linear systems. Connect the visual representation of the graph to the abstract algebraic methods.
Utah Education Network (UEN)
Linear Graphs Using Proportions and Rates
Using a TI-73 or other similar graphing calculator middle school math majors investigate the linear relationship of equivalent proportions. After a brief introduction by the teacher, class members participate in a timed pair share...


