Wordpress
Equation Table Graph
Your Algebra learners will appreciate this fabulous, two-page printable. The first page has a list of numbers that lead to the learners writing an equation in a cloud that represents these numbers, and then filling in a table, and...
Curated OER
Graphing Ordered Pairs
For this graphing ordered pairs worksheet, 9th graders graph five different sets of numbers on five different graphs. They identify that each of the x-coordinates tells the distance right (positive) or left (negative) and that each...
Curated OER
Chapter 5 - Objective 1.1 Graphing Ordered Pairs
In this ordered pairs worksheet, students graph given ordered pairs on a coordinate plane. This one-page worksheet contains three graphing problems.
West Contra Costa Unified School District
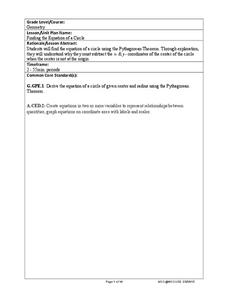
Finding the Equation of a Circle
Tired of going around and around for a resource on circles? Scholars determine the general equation of a circle on a coordinate plane, then participate in an activity matching equations to the radii and centers of the circles they...
Curated OER
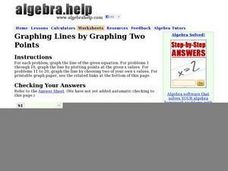
Graphing Lines by Graphing Two Points
Use a graphing lines worksheet to have your mathematicians graph the line of a given equation and plot specified points. The first 10 problems have a given equation, and two values. The next 10 problems have a given equation, but your...
Curated OER
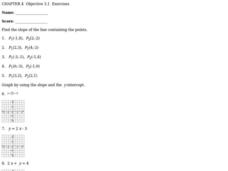
Slope of a Line
In this slope of a line worksheet, students solve ten problems determining the slope of points and an equation. First, they find the slope of the line containing the two points given in the first five problems. Then, students graph the...
Curated OER
Performance-Based Assessment Practice Test (Grade 6 Math)
Keep track of your sixth graders' mastery of the Common Core math standards with this practice assessment. Taking a different approach than most standardized tests, this resource includes not only multiple choice questions, but also free...
Curated OER
Graphing Linear Equations
In this graphing worksheet, students graph ten linear equations on each of the graphs provided. They first plug in some values to the given equation using a T-chart. This will give them their coordinates to use on the graph and form...
Curated OER
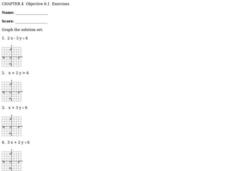
Graphing Inequalities
In this graphing inequalities worksheet, students solve and graph the solution set for eight inequalities. They first solve each inequality, either for x or for y, then they plot the coordinates found on the graph provided for each...
Curated OER
Chapter 11 - Objective 4.1 - Linear Equations
In this linear equation learning exercise, students solve linear equations and then graph the solution on a coordinate plane. This one-page learning exercise contains eight problems.
Curated OER
Find the Equation of a Line
In this equation of a line worksheet, 10th graders solve ten problems that determine locating the equation of a line. They first determine whether the given lines are perpendicular or parallel. Then students find the equation of the line...
Curated OER
Chapter 10 - Objective 6.1 Graph
In this graphing worksheet, students solve linear and parabolic equations and graph equations on a coordinate plane. They use the discriminant to determine the number of x-intercepts of a parabola. This one-page worksheet contains ten...
Virginia Department of Education
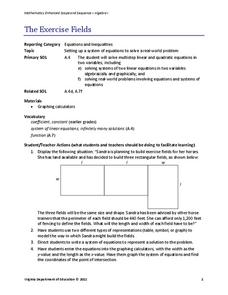
The Exercise Fields
Horses need exercise, too. Scholars create linear equations to model the perimeter of exercise fields for horses. They finish by solving their equations for the length and width of the fields.
Curated OER
Reaching New Heights
Learners explore the relationship between two variables. Students measure their arm span and height. They gather this class data to design a scatter plot. Learners interpret the meaning of individual coordinates and the overall graph....


