Curated OER
Compare Your Air
Middle schoolers will compare the data for different locations that they select and investigate trends over the course of a number of years. This will give the students an opportunity to apply statistical measures (mean, median,mode) to...
Curated OER
A Statistical Study on the Letters of the Alphabet
Students use a book or magazine to research the use of letters. They complete a worksheet and compare their results.
Curated OER
Population Ratios
Students access web site and record various population statistics pertaining to a county in the USA of their choice. They use this data to set up and solve ratios. They compare data to make meaning of the numbers.
Curated OER
Sculptural Statistics
Students conduct an experiment to determine the frequency of pulling various parts of an ancient Greek sculpture out of a hat.
Curated OER
Fire Fighting Crew
Students use the concepts in statistics to make decisions. They calculate the mean, median and mode. They compare one firefighter against another and analyze the data. They share their information with the class.
Curated OER
A RealSim Surface Look at Descriptive Statistics
Learners explore the concepts of mean and variance. They observe properties of materials to their basic atomic or molecular structure. Students use spreadsheet software to record, tabulate and analyze collected information.
Curated OER
What I Didn't Know...
High schoolers practice creating wikis. In this wiki lesson, students create a wiki about any math topic that they know nothing about. High schoolers learn about their topic and create a wiki that explains the math topic in detail.
Curated OER
6-8 Baseball Fun: Percentages, Decimals, and Fractions
Young scholars practice the concepts behind fractions, decimals, and percents by using sports statistics on baseball cards. In this baseball math lesson, students use fractions and estimation to calculate statistics. Young scholars...
Curated OER
Box Plots on the TI-83 Calculator
Eighth graders research box plots on the Internet. They gather real life statistics and analyze the collected statistics by making multiple box plots on the TI-83 calculator.
Curated OER
It All Adds Up
Students brainstorm reasons for politicians to expand recycling programs and find statistics to support recycling programs. They design posters, displaying a compelling statistic about recycling, to convince students at their school to...
Curated OER
Statistical Analysis of Data by Gender
Students examine and identify gender bias, stereotyping, and discrimination in school materials, activities, and classroom instruction. They apply descriptive statistics knowledge to real-world data.
Curated OER
Meaning of Alpha
learners define the alpha level. In this statistics lesson, students identify what makes the "null rejected" and discuss the data surrounding the null. They observe the meaning of alpha as it relates to the bell curve.
Curated OER
Acid Rain Simulation
Young scholars collect data on causes of Acid Rain. In this science lesson, students simulate the effects that produce acid rain, collect and analyze data from their samples. They relate science and statistics in this lesson.
Curated OER
Connecting Measurement
Students participate in activities the connect measurement to geometry, statistics, estimation, and the real world. They collect measurements from their elbow to the tip of their middle finger and make a box plot of the data as well as...
Curated OER
The Coyote Population: Kansas Prairies
Students discover animal lifestyles by researching their ecosystem. In this animal statistics lesson, students research the geography of Kansas and discuss the reasons why wild animals survive in the open Kansas fields. Students complete...
Curated OER
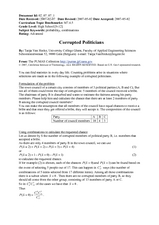
Corrupted Politicians
Students solve problems using statistics and probability. In this math lesson, students analyze how many corrupted members there are in a fictional town council. They give real life examples where statistics and probability can be used.
Curated OER
Graphing in the Information Age
Middle schoolers create a variety of graphs based on population data. In this statistics lesson, students use data that can be gathered on-line to make a bar chart, line graph, and circle graph.
Curated OER
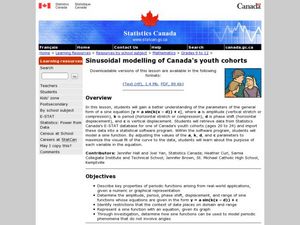
Sinusoidal modelling of Canad'a youth cohorts
Students explore the general form of the sine equation. In this trigonometry lesson, students explore the relationship between the changing parameters and the graph of the sine equation. Students use data and a statistical...
Curated OER
Probability: The Study of Chance
Learners practice the basic principles of probability by conducting an experiment, determining if a game is fair, collecting data, interpreting data, displaying data, conducting analysis, and stating and applying the rule for probability.
Curated OER
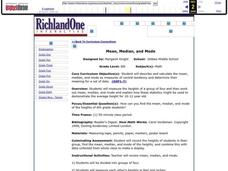
Mean, Median, and Mode
Students calculate measures of central tendency. in this mean, median, and mode lesson, students calculate the measures of central tendency. They organize data, examine and explain the statistics.
Curated OER
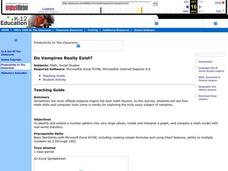
Do Vampires Really Exist?
Pupils identify and extend a number pattern into very large values. They create and interpret a graph based on their number patterns. Students compare a math model with real-world statistics about the existence of vampires.
Curated OER
National Longitudinal Survey of Children and Youth (NLSCY)
Students review data analysis techniques. For this statistics lesson, students access statistical software regarding the National Longitudinal Survey of Children and Youth. Students read and interpret the data as they complete the...
Curated OER
Exploring Gender Bias in the Workplace
Students investigate gender bias in the work place. In this secondary mathematics lesson plan, students gather research on the current statistics about a profession which focuses on the female//male ratios and the pay scale of the...
Curated OER
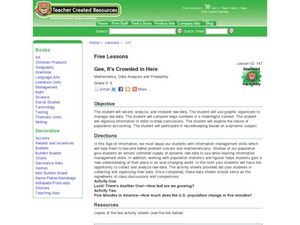
Gee, It's Crowded in Here
Young scholars interpret raw data about population statistics. In this raw data lesson plan, students plug the data into graphic organizers and draw conclusions based on their findings.
Other popular searches
- Football Math Statistics
- Baseball Math Statistics
- Math Statistics Simulation
- Math Statistics Survey
- Math Statistics Lesson
- Games Math Statistics
- Math Statistics Histograms
- Sneeze Math Statistics
- Saxon Math Statistics
- Statistics Math Project
- Jeopardy Math Statistics
- Math Statistics Correlation

