American Statistical Association
A Sweet Task
Candy is always an effective motivator! A fun math activity uses M&M's and Skittles to explore two-way frequency tables and conditional probability. The candy can serve a dual purpose as manipulatives and experimental data.
Curated OER
M&M Graphing
Youngsters sort M & M's by color. They graph the M&M's by color on a graph. This classic lesson is a wonderful way to introduce the concept and technique of graphing to young mathematicians. Pairs of kids can make up their own...
Curated OER
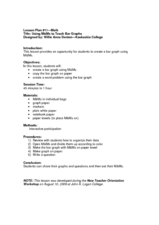
Using M&M's to Teach Bar Graphs
Motivate your class with this lesson. While not fully fleshed out, this activity is meant to be used as an introduction to the use of bar graphs. Learners sort M&M's and create bar graphs to display their information.
Curated OER
Data Analysis and Probability: Graphing Candy with Excel
Collect and graph data using Microsoft Excel with your math class. They will make predictions about the number of each colored candy in a bag of M&M's, then sort, classify, count, and record the actual data before using Excel to...
Curated OER
Probability Using M&M's
Students estimate and then count the number of each color of M&M's in their bag. In this mathematics instructional activity, students find the experimental probability of selecting each color from the bag. Students create pictographs...
Curated OER
M&M’s Math Worksheet
Who knew you could cover prediction, histograms, fractions, decimals, data collection, and averages (mean, median, and mode) all with a bag of M&M's®? Here's a fantastic set of worksheets to help you make candy a mathematical journey...
Curated OER
Bungee M&M's
Science is exciting - and delicious! Pairs of learners set up a bungee cord type of experiment. They use buckets filled with M & M's, a meter stick, and a Slinky spring (as the bungee) to conduct their experiment. A good activity...
Curated OER
M&M Graphing
Fourth graders name colors of M&Ms and record answers. They estimate number of M&Ms of each color found in a typical package of M&Ms on piece of paper.They record information on sheet of paper and create a spreadsheet. paper.
PBS
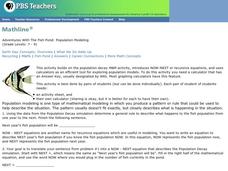
Adventures With The Fish Pond: Population Modeling
Build up from the previous activity where your learners charted the population growth and decay of a fish pond with M&Ms®. Have them look at the data from that activity and create a Now-Next, or recursive equations, to predict the...
Curated OER
M&M's and the Scientific Method
Sixth graders explore the scientific method by conducting an in class experiment. In this scientific averages lesson plan, 6th graders discuss the concept of the scientific method, and define the different mathematical averages, mean,...
Curated OER
M&M Science and Math
A series of math and science activities feature M&M's® as manipulatives to help kids work through equations. The resource includes exercises on finding averages, percent of compositions, moles in chemical reactions, genotypes and...
Curated OER
Statistical Calculations Using M&Ms
In this frequency activity, students investigate, frequency, box plots, and percentage using a package of M&Ms. Copies of the actual correspondences with the Mars company are also included.
Curated OER
M & M Madness
M&M's are always a great manipulative to use when teaching math. In this graphing lesson plan, learners predict how many of each color of M & M's there are. They count up each color and plug the data into a graph using the...
Curated OER
Get a Half Life!: Student Worksheet
Upper elementary or middle schoolers will explore non-linear functions, graphing, and the curve of best fit through real-life data collection and trial analysis. They explore the concept of half-life and radioactive decay using M&Ms,...
Curated OER
Mmm, Mmm, M&M's
Here is another version of the classic M&M math lesson. For this one, upper graders utilize the ClarisWorks Spreadsheet program in order to document the data they come up with from their bags of M&M's. After making their initial...
Curated OER
Statistics with M&Ms
Seventh graders explore estimation, measurement, and probability. Students conduct surveys and create charts & graphs. They study the history of chocolate. Students design their own magazine advertisement or create a script for a...
Curated OER
Math: How Many Red M&Ms?
Sixth graders calculate the mean, median, and mode of candy M&Ms and find the percentage of each color. Once they complete the assignment, they compare their results with those of the candy company's percentages. As an extension,...
Curated OER
Edible Math
Second graders use M&M candies to graph colors, illustrate story problems and practice hands-on math. They use spreadsheets, worksheets and graphs to organize math problems that use M&M's.
Curated OER
M&Ms; Line Plots and Graphing
Students, using small individual bags of M&Ms, engage in activities including; estimating, sorting, graphing, mean, median, mode, fractions, percentage, and averaging.
Curated OER
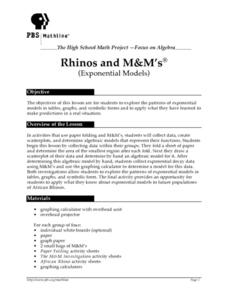
Rhinos and M&M's
Young scholars analyze patterns of exponential models by collecting data in paper folding and M&M investigations. They use graphing calculators to create scatter plots that lead to equations for the exponential models. They then...
Curated OER
RIP M&M's
Students solve theoretical probability problems. For this algebra lesson, students apply the concept of probabilities to solving real life scenarios. They collect data and graph it using experimental probability.
Curated OER
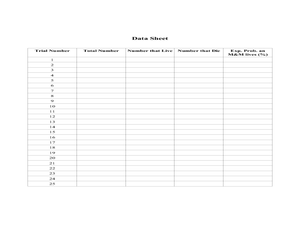
M&M's Candies Worksheet Graph
In this graphing worksheet students will record data on a bar graph. Students will take a bag of M&M's and chart the colors they find inside this bag.
Curated OER
Which Graph is best?
Students use commercial software to organize and visually display data to draw conclusions; students use graphing software to create several types of graphs illustrating the number of each color of M&M's in one bag.
Curated OER
Statistics of Mars
Students explore the concept of central tendencies. In this central tendencies lesson, students sort M&M's or Skittles based on color. Students graph their results. Students find the mean, median, and mode of their data.


