Curated OER
It Has Been Rubbish For Years
Young scholars are presented with the problems of percentages and focus upon numbers in contrast to 100. They calculate problems with money and are engaged with the use of games as a teaching tool. Students also interpret data as...
Curated OER
Forest Life- Wood Bug Study
Examine wood bugs and their habitat. Learners gather wood bugs and examine their bodies. Then discuss their body parts and how they help them survive. They also predict where they think wood bugs live to then graph the class results.
Curated OER
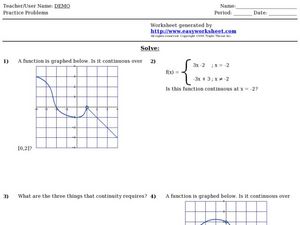
Piecewise Practice Problems
For this algebra worksheet, students validate continuity of a graph by a defined interval as well as determine continuity of a piecewise function.
Curated OER
Red Worms Rock!
Second graders measure red worms. In this lesson plan, 2nd graders observe and collect data on red worms. Students measure the red worms and create a graph with the data they collect.
Curated OER
Number Pairs
As you introduce graphs and coordinate pairs, use this guided activity to get scholars started. They reference an example before recording number pairs to identify the location of 12 letters on a grid. Next, learners examine shapes on a...
Los Angeles County Office of Education
Assessment for the California Mathematics Standards Grade 5
Test young mathematicians' knowledge with an assessment aligned to California's fifth grade state standards. The exam covers a multitude of concepts including fractions and decimals, positive and negative numbers, measurement; and how to...
Mt. San Antonio Collage
Quiz 1: Functions, Domain and Range
Take the work out of worksheets and use these problems and worked-out answer key as a resource. The problems reinforce skills in domain and range, identifying graphs, and even and odd functions.
Mathematics Assessment Project
Classifying Solutions to Systems of Equations
Double the fun of solving a linear equation with an activity that asks learners to first compete an assessment task graphing two linear equations to find the common solution. They then complete a card activity solving systems of...
Willow Tree
Solving Inequalities
What does solving an inequality have in common with solving an equation? Almost everything! A math resource focuses on the one exception. The examples lead learners through the steps of solving an equality when multiplying or dividing by...
University of Utah
Simultaneous Linear Equations
Solve simultaneous linear equations, otherwise known as systems of linear equations. Pupils practice solving systems of linear equations by graphing, substitution, and elimination. The workbook provides a class activity and homework for...
Curated OER
Buses
Busy buses bustling back and forth. In this middle school assessment task, learners use information given in a graph to answer questions about bus schedules. They then determine how many times a bus passes by other buses going in the...
PBL Pathways
Students and Teachers 2
Examine trends in student-to-teacher ratios over time. Building from the first task in the two-part series, classes now explore the pattern of student-to-teacher ratios using a non-linear function. After trying to connect the pattern to...
Concord Consortium
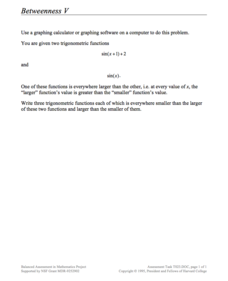
Betweenness V
Take a unique approach to study the graphing of trigonometric functions. Young scholars consider two sine functions and write three functions that will lie between the two given. They use a graphing utility to assist in their explorations.
Concord Consortium
Writing and Sketching II
Find the function that fits. Scholars first identify the graph of a function that looks the same after a horizontal translation. They must then find the equation of a function whose graph lies only in two adjacent quadrants.
Mathematics Vision Project
Module 3: Features of Functions
Learn how to represent functions in multiple ways. Learners analyze functions as equations, graphs, and verbal descriptions. The analysis includes intercepts, behavior, domain, and range. The module of seven lessons makes up the third...
Concord Consortium
Sum and Product
From linear to quadratic with a simple operation. An exploratory lesson challenges learners to find two linear functions that, when multiplied, produce a given parabola. The task includes the graph of the sum of the functions as well as...
Concord Consortium
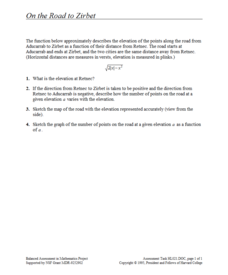
On the Road to Zirbet
The road to a greater knowledge of functions lies in the informative resource. Young mathematicians first graph a square root function in a short performance task. They then use given descriptions of towns and the key features of the...
Concord Consortium
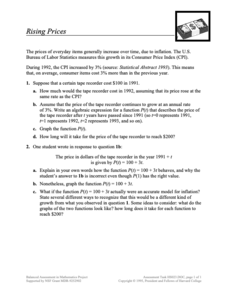
Rising Prices
What will that cost in the future? The scenario provides pupils with a growth as a Consumer Price Index. Learners create functions for a given item to determine future prices and graph them. Class members then compare their functions to...
EngageNY
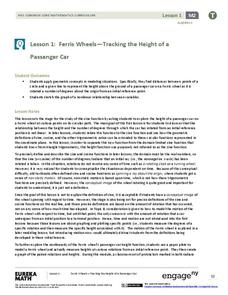
Ferris Wheels—Tracking the Height of a Passenger Car
Watch your pupils go round and round as they explore periodic behavior. Learners graph the height of a Ferris wheel over time. They repeat the process with Ferris wheels of different diameters.
Shodor Education Foundation
Ordered Simple Plot
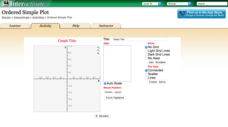
Open your imagination to make algebra-inspired creations. An interactive lesson has scholars graph images from a set of parameters. Users can practice minimum values, maximum values, and scale as well as key features.
Curated OER
Physical Science: Festival of Bubbles
Investigate bubbles through the use of scientific inquiry. Pupils blow bubbles using several methods and measure the resulting bubble print. Measurements are recorded on a data table and transferred to a bar graph. Results are discussed...
Lake Zurich Community Unit
Inequality Word Problems
This inequality word problems activity is ideal to assess your learners' understanding of inequality and linear concepts around solving and writing equations and inequalities. Equations, graphs and real-life scenarios are used to assure...
Shmoop
Box, Stem-Leaf, and Histogram
A helpful and versatile learning exercise requires young mathematicians to analyze data in order to create graphs and answer questions. Additionally, it prompts learners to find the mean, median, mode, and range of some of the data sets.
Illustrative Mathematics
Which Function?
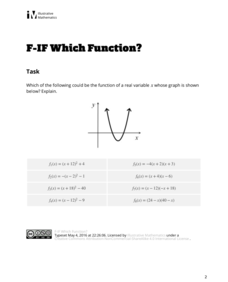
Throw some logic into quadratics and see if learners can match a vague graph to multiple equations. Young mathematicians must look at quadrant location, vertices, and intercepts to best match the graph to one or more equations.
Other popular searches
- Charts and Graphs Math
- Hidden Picture Math Graphs
- Misleading Graphs Math
- Powerpoint Math Graphs
- 1st Grade Math Graphs
- Math Graphs 4th Grade
- Math Reading Graphs
- Animals Math Graphs
- Math Graphs Grade 1
- Creating Math Graphs
- Math Graphs Using M&ms
- Math Interpreting Graphs


