Curated OER
Graph Picture (Coordinate Pairs) 2
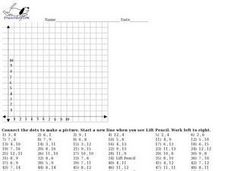
Looking for an engaging way to encourage your class to practice graphing coordinate pairs? This might be the activity you are looking for! For this instructional activity, learners create a picture by plotting 54 coordinate pairs on...
Curated OER
Graph Picture (Coordinate Pairs) 3
Here is a very good coordinate graphing learning exercise. Learners practice graphing by plotting 58 coordinate pairs, then connecting the dots to reveal a picture. This resource could be used as an in-class activity or a homework...
Curated OER
The Father of Our Country
Explore United States history with this lesson on George Washington and the Revolutionary War. After reading biographical information about George Washington, learners make a list of ten reasons for the revolution. They create a timeline...
Concord Consortium
Twinkle, Twinkle
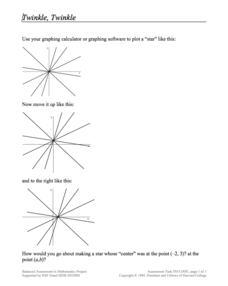
Take a look at a star resource. Young mathematicians use a graphing calculator to draw intersecting lines that look like a star. They then apply translations to move the entire star and also consider what transformations must occur to...
CCSS Math Activities
Social Security Trust Fund
Will Social Security still be around when you retire? Given data on the predicted balance of the social security fund over time, scholars plot the points on a coordinate grid and determine if a quadratic regression fits the data. They...
Curated OER
M&M Exponential Activity
Students create a scatter plot of their experimental data. In this algebra lesson, students use M&M's to determine an algebraic model. They discuss results in class.
Curated OER
Track's Slippery Slope
Students graph data of sports figure running time using x-axis y-axis to find slope of trend line, mathematically find the interpolated and extrapolated values for data points. Using the information they make predictions.
Curated OER
Measuring Mania
Students rotate through stations in the classroom, completing different types of measurements. These measurements are placed into a spreadsheet, and a scatter plot is generated. They type an explanation of their results in correlation...
Curated OER
Charting Attendance Rate of Busch Gardens
Sixth graders, in groups, are given different parts of the whole project. They use information from Busch Gardens to explore line graphs, averages, and other math vocabulary.
Curated OER
Exploring Geometric Patterns and Relationships
Sixth graders explore different geographic relationships in like drawing lines, rays, and parallelograms. This lesson plan could be used for review because it covers more than one concept. The students should have prior knowledge.
Curated OER
Philanthropic Literature: Give a cookie
Students read a book to discover the importance of sharing. They predict what will happen in the story. Students use manipulatives to model the story problem. Students follow instructions, measure ingredients, and make cookies.
Curated OER
Choosing the Correct Pronoun Case
In this pronouns worksheet, students complete a ten question multiple choice on-line interactive quiz about pronouns. From two choices, students select the correct pronoun to finish each sentence.
Curated OER
What's Up With My Class
Learners collect data about their class and they use Excel spreadsheet to display their tables and graphs about the class. They answer survey questions and collect their data. Students create a graph of their choice to display the...
Curated OER
Student Heights
Students measure the heights of their fellow classmates and create a box and whisker plot to display the data. In this measurement lesson plan, students analyze the data and record results.
Curated OER
Prime Factorization, Equivalent Fractions and GCF review
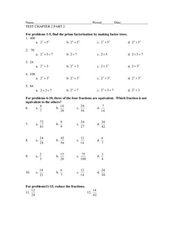
In this sample test worksheet, students solve twenty-five problems covering prime factorization, equivalent fractions, greatest common factor, and plotting on a number line. Solutions are provided.
Curated OER
Breakfast Cereal - How Nutritious Is Yours?
Middle schoolers analyze the nutritional value of breakfast cereal in order to make an informed choice. They create a stem and leaf plot which analyzes the nutritional value of the cereal they eat on a regular basis. Students write a...
Curated OER
Creeping
Students observe, measure, and graph a model of slow down slope movement representing soil creep. This task assesses students' abilities to collect, record, and organize data, set up graph axes, plot data points, draw line graphs, apply...
Curated OER
Stemmin'-n-Leafin'
Students make stem and leaf charts to determine the measures of central tendency using test score data. They analyze the data to draw inferences which they share with the class. They complete the associated worksheets.
Curated OER
The 400-Meters Race
Students collect and graph data. In this algebra activity, students describe, interpret and analyze data. They follow a 400 meters race and plot the coordinates of the course. They graph a line to represent the data of the course.
Curated OER
Sports Data for the Classroom
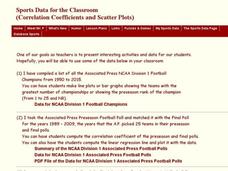
In this algebra worksheet,students rewrite word problems using algebraic expressions. They collect data and plot their findings on the graph and analyze it. There is an answer key for this worksheet.
Virginia Department of Education
May I Have Fries with That?
Not all pie graphs are about pies. The class conducts a survey on favorite fast food categories in a lesson on data representation. Pupils use the results to create a circle graph.
Curated OER
Poetry Shopping Spree
Scholars demonstrate the ability to evaluate authors' use of literary elements such as metaphor, simile, personification, imagery, and onomatopoeia. They are provided with a checklist and must shop for poems that contain the poetry terms...
Los Angeles County Office of Education
Assessment for the California Mathematics Standards Grade 7
In need of an all-inclusive seventh grade math resource? Packed full of the topics necessary for Pre-Algebra the packet includes practice problems with different difficulty levels. It works great for any supplemental use needed...
Curated OER
Bungee Jump Lab
Student apply linear relationships to the real world. They use Ken and Barbie dolls and experiment to find the line of best fit. They collect data, analyze data, and make predictions from it. The young scholars also use Microsoft Power...
