Curated OER
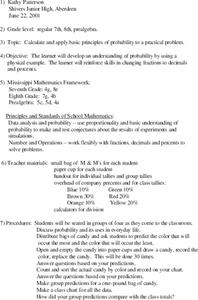
Probability using M & M's
Using M & M's candies, young statisticians predict the color distribution in a packet of candies and test their predictions against their group and the larger class. A review of converting between fractions, decimals, and percents...
National Security Agency
It's Probably Probable
Learners make predictions and draw conclusions from given information as they learn the meaning of probability in this vocabulary-rich, integrated activity that presents a variety of teaching strategies to motivate and reach all learning...
Curated OER
Triangle Inequality Theorem
Students identify properties of triangles. In this geometry lesson, students create triangles using three different segments. They make conjectures and predictions.
Curated OER
Taking Its Toll
Students explore ratios. In this rates lesson, students create a ratio to compare the price of a toll to the distance travelled. They compute the average cost per mile, determine the slope between two ordered pairs, and make...
Curated OER
Data Analysis and Probability: Graphing Candy with Excel
Collect and graph data using Microsoft Excel with your math class. They will make predictions about the number of each colored candy in a bag of M&M's, then sort, classify, count, and record the actual data before using Excel to...
101 Questions
Trashketball
Take a shot using a lesson on volume! Young learners watch a video showing a trashcan filling with paper balls. The task is to calculate the number of paper balls that will fit in the can. Pupils use volume calculations to make a...
California Education Partners
Summer Olympics
Quickly get to the decimal point. The last assessment in a nine-part series requires scholars to work with decimals. Pupils compare the race times of several athletes and calculate how much they have improved over time. During the second...
Curated OER
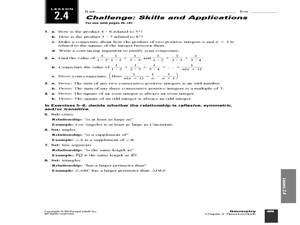
Challenge: Skills and Applications Lesson 2.4
In this algebra worksheet, students create arguments using conjectures. They identify the sequence and the pattern and formula. They solve products and prove sum of integers. There are 8 questions.
Curated OER
Making Parallel Lines
Students differentiate between parallel and perpendicular lines. In this geometry lesson, students make conjectures and apply it to solve real life situations. They collect data and make predictions based on the data.
Curated OER
Geometry Jeopardy
Young scholars identify the pattern in a problem. For this geometry lesson, students make predictions, collect and analyze data. They apply the idea of scales and measurements to the real world.
Curated OER
What's the Chance of Rain? Lesson Plan 2
Students utilize and interpret numerical statements regarding rainfall patterns which quantify chance. They design and prepare surveys and experiments to answer questions or test conjectures and predictions.
Texas Instruments
Transformational Puppet
High Schoolers create a puppet and make predictions using the TI Navigator. In this math lesson, they will discuss their results as they explore transformation. This assignment requires the TI navigator or a smartboard.
Curated OER
Logarithmic Transformations
Using the TI calculator to visualize and make predictions, students perform transformation vertically and horizontally on logarithmic graphs in order to solve problems.
EngageNY
Exponential Growth—U.S. Population and World Population
Show how exponential growth can look linear. Pupils come to understand the importance of looking at the entire picture as they compare the US population to the world population. Initially, the populations look linear with the same rate...
Inside Mathematics
Scatter Diagram
It is positive that how one performs on the first test relates to their performance on the second test. The three-question assessment has class members read and analyze a scatter plot of test scores. They must determine whether...
Improving Measurement and Geometry in Elementary Schools
Rep Tiles
In addition to the catchy title, this lesson plan provides upper graders an opportunity to more closely scrutinize the attributes of plane figures. In particular, they focus on the similarity of different shapes. Both whole-class and...
EngageNY
Even and Odd Numbers
Even or not, here I come. Groups investigate the parity of products and sums of whole numbers in the 17th lesson plan in a series of 21. Using dots to represent numbers, they develop a pattern for the products of two even numbers; two...
Curated OER
It's Not Conjecture, Look! It's Architecture!
Young scholars examine how architecture reflects historical time periods. They conduct research on the History Detectives website, complete a fact sheet, sequence photographs of different architectural styles, and create an...
Pennsylvania Department of Education
Equally Likely and Unequally Likely Outcomes
Students explore probability. In this statistics/probability lesson, students compare experimental and theoretical probability and use experimental probability to make predictions and conjectures. Students explore the distinction...
Curated OER
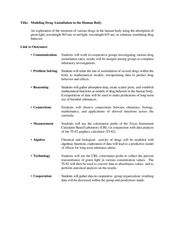
Modeling Drug Assimilation in the Human Body
Students investigate the accumulation of drugs in the body. In this algebra lesson, students collect data on drug retention and assimilation. They use their data to predict the behavior and effects of drugs.
Curated OER
Regressive Music
Student use the Ti calculator to graph sinusoidal graphs. In this calculus lesson plan, students use the CBL to collect and analyze data of sinusoidal graphs. They manipulate their collected data and make predictions.
Curated OER
Taking Poll Information
Students investigate the election and poll surveys. In this statistics instructional activity, students take poll information and analyze the data. They graph their data and make predictions and conjectures.
Curated OER
Probability and Statistics
Students are taught to search the internet for statistics concepts on sports. For this probability lesson, students collect data and use the calculator to graph and analyze their data. They graph and make predictions about sports using...
Curated OER
Technology Literacy Challenge Grant Learning Unit
First graders explore counting and classification. They sort leaves, create graphs, write sentences for the data in the graphs, develop graphs for shapes, favorite animals, birthdays, and participate in a die prediction game.


