Other
Stat Trek: Data Patterns in Statistics
This lesson looks at how to recognize patterns in a data display by examining the shape of a graph, the center, the spread, and unusual features such as outliers. Includes video. [11:16]
CK-12 Foundation
Ck 12: Types of Data Representation: Graphic Displays of Data
[Free Registration/Login may be required to access all resource tools.] Here you will explore displays of data using bar charts, histograms, pie charts and boxplots, and learn about the differences and similarities between them and how...
Other
Bscs: Frog Symphony
In this self-directed lesson, students use maps and graphs of data to investigate the habitats and time of year and day to hear a full chorus of frogs. A handout with everything the student needs to complete this lesson is available as a...
CK-12 Foundation
Ck 12: Graphic Displays of Data
[Free Registration/Login may be required to access all resource tools.] In this lesson, students compare different types of graphic displays to understand how to choose the best method of displaying their data, and they learn the...
Better Lesson
Better Lesson: Graphing Using a Frequency Table
Multiple graphs can represent the same data set and make the information easier to understand.
Howard Hughes Medical Institute
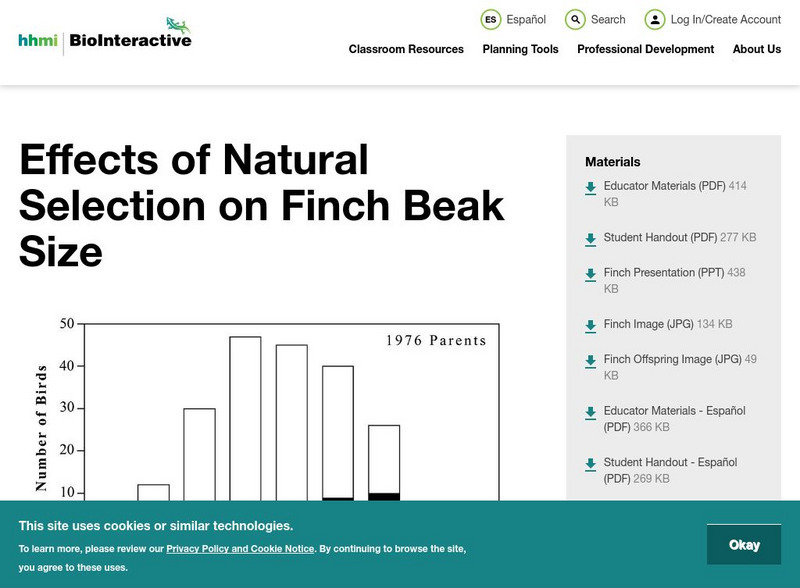
Hhmi: Bio Interactive: Effects of Natural Selection on Finch Beak Size
In this activity, students examine research on finches on the island of Daphne Major in the Galapagos Islands. The depth of the finches' beaks was measured before and after a drought. This data is displayed in graphs and students are...
National Council of Teachers of Mathematics
Nctm: Illuminations: State Names
Students use multiple representations to display how many times the letters of the alphabet is used in a state name. Concepts explored: stem and leaf, box and whisker plots, histograms.
Shodor Education Foundation
Shodor Interactivate: Pie Chart
Students investigate how a pie chart can be used to display data graphically. The resource includes the activity and instructor resources.


