Illustrative Mathematics
Teen Go Fish
Kindergartners play the classic game Go Fish as they practice identifying numbers in the teens. A fun and engaging activity that develops number recognition skills in young learners. As added support, provide cards that include both the...
Curated OER
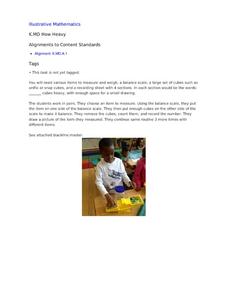
How Heavy
Break out the balances for this primary grade lesson on weight measurement. Using common elementary school manipulatives like unifix or snap cubes, young mathematicians determine the weight of four different classroom objects. A graphic...
Illustrative Mathematics
How Long
It won't take young mathematicians long to learn how to measure length with this fun, hands-on activity. Working in pairs, children use Unifix® or snap cubes to measure and record the lengths of different classroom objects. To extend the...
Curated OER
Author Study: Cynthia Rylant
Explore the life's work of one of the great children's authors using this ten-lesson author study unit. After first performing some whole-group research into the life of Cynthia Rylant, the class goes on to read six different...
Civil War Trust
Civil War Animal Mascots
A pet can offer comfort, friendship, and loyalty in the most stressful of situations. Here is a lesson plan that explores the important role animals played during the Civil War. Class members read informative texts, complete a...
Chicago Botanic Garden
Causes and Effects of Climate Change
Wrap-up a unit on global climate change with a lesson that examines the causes and effects of climate change. Learners fill out a chart that represents what they think causes climate change—natural and human-based—and what they think...
CK-12 Foundation
Conversions between Degrees and Radians: Charting Hours in the Day
Forget hours, divide the day into radians instead. Class members convert the angles in a pie chart of daily activities into radian measures. They add angle measures for multiple activities then determine a relationship between the radian...
CK-12 Foundation
Interpretation of Circle Graphs: Northwest Region Population Pie
Given populations of the five Northwestern states, learners create a circle graph. Using the data and the pie chart, they make comparisons between the populations of the states. Finally, the pupils determine how the chart will change...
CK-12 Foundation
Multiple Bar Graphs
I scream, you scream, we all scream for ice cream bar graphs. Pupils create a multiple bar chart to represent the sales of ice cream products during the first week of summer. Using the chart, learners find the day that each of the...
Reed Novel Studies
The Incredible Journey: Novel Study
There's no place like home. Three family pets prove this in The Incredible Journey as they head out to find their way back home. Scholars read about the dangers the pets face on their journey while they learn eight vocabulary words from...
Reed Novel Studies
Skink No Surrender: Novel Study
The oldest turtle ever recorded lived to the age of 188! As it turns out, two characters from Carl Hiaasen's Skink No Surrender are fascinated by these shelled creatures. Using the novel study, scholars research three types of...
Reed Novel Studies
The Year of Billy Miller: Novel Study
Can you really knock the sense into someone? It seems that the bump on Billy's head changed his perspective on things in The Year of Billy Miller. Readers discover that after his injury, Billy appreciates his parents more and is nicer to...
Pace University
Jacksonian Democracy
Jacksonian Democracy ... a total success or a complete failure? Young academics examine Jacksonian Democracy, including the concept of the supremacy of the federal government and the forced relocation of Native Americans. Scholars...
Curated OER
Fine Arts in School
In this math chart worksheet, students use the chart to answer the questions. The information on the chart is about students who participate in fine arts.
Curated OER
Ready to Round
First graders are introduced to the concept of rounding to the nearest ten through the use of a number line created from a hundreds chart.
Curated OER
Tally Charts
In this tally charts worksheet, students fill in the tally chart with the item, tally, and number. Students have 2 tally charts to complete.
Curated OER
Seasons
First graders create a KWL chart about the four seasons. In this four seasons lesson plan, 1st graders continue the chart by watching videos and drawings.
Curated OER
Out of the Dust 3
Students read the novel, Out of the Dust, and complete a cause and effect chart and a character chart. When the book is completed, they answer review questions.
Curated OER
Tally Charts and Graphs
Fourth graders play the game 'Data Picking', where they collect data, place the data into a tally chart, and choose the circle graph that best represents the data. They go to the Mathfrog website and select 'Picking'. Students choose...
Curated OER
Keys to Growth in Christ
Young scholars explore ways to grow close to Jesus Christ. In this religious studies instructional activity, students read and analyze scripture from John, Matthew, and Romans. Young scholars then complete a KWLQ chart based on the...
Curated OER
Ancient China
Students research different dynasties that existed in China around different themes. They chart each dynasty for written assessment. Each chart has details that chronicles the gathered information.
Curated OER
Charting Mold Growth
Students chart mold growth based on food supply. In this mold growth lesson plan, students chart micro-organism growth and the decline of the growth as food runs out.
Curated OER
Ocean Animals
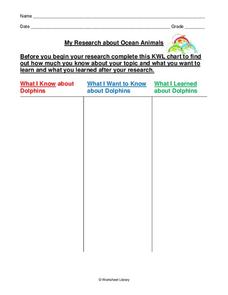
In this dolphins worksheet, students fill in a KWL chart about dolphins. Students fill in what they know, what they want to know, and what they learned about dolphins.
Curated OER
Basic Knowledge of Big Cats
First graders create a KWL chart on big cats. In this animal science lesson, 1st graders brainstorm what they already know about big cats and research big cats using various suggested websites. Students fill in the last column of the KWL...


