EngageNY
Modeling with Exponential Functions
These aren't models made of clay. Young mathematicians model given population data using exponential functions. They consider different models and choose the best one.
Shodor Education Foundation
Multi-Function Data Flyer
Explore different types of functions using an interactive lesson. Learners enter functions and view the accompanying graphs. They can choose to show key features or adjust the scale of the graph.
Education Development Center
Creating a Polynomial Function to Fit a Table
Discover relationships between linear and nonlinear functions. Initially, a set of data seems linear, but upon further exploration, pupils realize the data can model an infinite number of functions. Scholars use multiple representations...
EngageNY
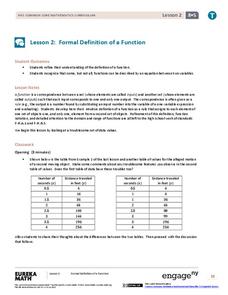
Formal Definition of a Function
Formalize the notion of a function. Scholars continue their exploration of functions in the second lesson of the module. They consider functions as input-output machines and develop function rules for selected functions.
EngageNY
Graphs of Quadratic Functions
How high is too high for a belly flop? Learners analyze data to model the world record belly flop using a quadratic equation. They create a graph and analyze the key features and apply them to the context of the video.
EngageNY
The “WhatPower” Function
The Function That Shall Not Be Named? The eighth installment of a 35-part module uses a WhatPower function to introduce scholars to the concept of a logarithmic function without actually naming the function. Once pupils are comfortable...
EngageNY
Linear Functions and Proportionality
Connect linear equations, proportionality, and constant rates of change to linear functions. Young mathematicians learn how linear equations of the form y = mx + b can represent linear functions. They then explore examples of linear...
EngageNY
Revisiting the Graphs of the Trigonometric Functions
Use the graphs of the trigonometric functions to set the stage to inverse functions. The lesson reviews the graphs of the basic trigonometric functions and their transformations. Pupils use their knowledge of graphing functions to model...
Concord Consortium
Functions by the Slice
Piece by piece ... dismantling a function can highlight interesting patterns. The task asks learners to slice functions in sections with the same vertical change. They then recreate the graph with these slices positioned horizontally....
Mathematics Vision Project
Quadratic Functions
Inquiry-based learning and investigations form the basis of a deep understanding of quadratic functions in a very thorough unit plan. Learners develop recursive and closed methods for representing real-life situations, then apply these...
Virginia Tech
Unit Plan: Exponential and Logarithmic Functions
A six-day unit for algebra II on exponential and logarithmic functions builds upon Chapter 12 of Merrill Algebra II with Trigonometry; Applications and Connections. The text provides assistance in the depth of instruction and homework...
Radford University
Regression Analysis Activity
Don't let your knowledge of regression analysis regress. Pupils take part in three activities to learn about regression curves. They research and collect data to predict how long it will take a basketball to hit the ground, find a...
American Statistical Association
Nonlinear Modeling: Something Fishy
There are plenty of fish in the sea, but only a few good resources on regression. Young mathematicians first perform a linear regression analysis on provided weight and length data for fish. After determining that a linear model is not...
Mathematics Vision Project
Module 4: Polynomial Functions
Bridge the gap between graphical and algebraic representations. Learners complete six lessons that begin by pointing out connections between the key features of a polynomial graph and its algebraic function. Later, pupils use the...
Radford University
Projectile Motion and Quadratic Functions
Model the flight of a ball. Small groups collect time data for how long it takes to toss a ball between two people. The teacher leads a discussion about projectile motion to get the class thinking about how to calculate the equation of...
Howard Hughes Medical Institute
Spreadsheet Tutorial 1: Formulae, Functions, and Averages
Spread your knowledge of spreadsheets. The first of five tutorials in the Spreadsheet Data Analysis unit introduces the basics of spreadsheets. It shows future data analysts how to organize and format tables, and how to use functions to...
Physics Classroom
Position-Time Graphs - Conceptual Analysis
Increasingly, colleges and employers want applicants with strong conceptual analysis skills, so give them some practice! Applying these skills to position-time graphs encourages synthesis of knowledge. To complete an installment of a...
Curated OER
Discovering Different Types of Functions
Graph polynomials and identify the end behavior of each polynomial function. The class differentiates between linear, quadratic, and other polynomial equations.
Curated OER
Graphs and Transformations of Functions
Is it possible to solve quadratic equations by factoring? It is, and your class will graph quadratic equation and functions too. They perform transformation on their graphs showing increasing and decreasing intervals, domain, and range....
Curated OER
Using Computer for Statistical Analysis
Students use the computer and S'COOL data for statistical analysis.
Curated OER
Graphs and Functions
Use this series of activities to introduce learners to graphing functions. They graph both linear and quadratic equations by hand and with a Graph Sketcher Tool. Several imbedded links and handouts are included in the lesson plan.
Curated OER
Building Boxes- Polynimial And Rational Functions
Students investigate the concepts of polynomial and rational functions. They identify the general patterns used to solve problems. The use of real world contexts in the problems helps to promote engagement and understanding of how the...
Curated OER
Challenge: Graphing Functions
Here is a functions worksheet in which learners solve functions containing variables, graph the coordinates, and answer two questions about it. They complete 14 functions.
Curated OER
Graphs and Data
Pupils investigate poverty using graphs. In this algebra lesson, students collect data on the effects of poverty and use different rules to analyze the data. They graph and use the trapezoid rule to interpret the data.


