Perkins School for the Blind
Name That Frequency
How cool! This plan uses old cassette tapes to show frequency from traveling vibrations. To prepare for the lesson, tactile frequency diagrams are made and then placed near the video tapes or dominoes that are already set up. When they...
Curated OER
Completing frequency diagrams from displayed data
In this frequency activity, students use data in graphs and charts to complete a frequency diagram. Students fill in 26 spaces in the diagram.
Curated OER
Completing Frequency Diagrams from Displayed Data
In this frequency diagram worksheet, students use a bar chart, stacked bar chart and pie chart to complete frequency tables. A reference web site is given for additional activities.
Curated OER
Make a Frequency Table and a Histogram for a Given Set of Data
In this data recording and data organization learning exercise, students create one frequency table and one histogram for a given list of data. Explanations and examples for frequency tables and histograms are given.
Centre for Innovation in Mathematics Teaching
Ten Data Analysis Activities
This thirteen page data analysis worksheet contains a number of interesting problems regarding statistics. The activities cover the concepts of average measurements, standard deviation, box and whisker plots, quartiles, frequency...
Willow Tree
Histograms and Venn Diagrams
There are many different options for graphing data, which can be overwhelming even for experienced mathematcians. This time, the focus is on histograms and Venn diagrams that highlight the frequency of a range of data and overlap of...
Curated OER
Frequency Tables; Discrete Ungrouped Data
In this frequency tables activity, students utilize given data to work out three frequency charts with one containing values and a pie chart involving angles for each value. Students complete three vertical line diagrams and check all...
Curated OER
Creating Frequency Tables
In this frequency table activity, students explore a given set of numbers. They group the data and create a frequency table. This one-page activity contains ten problems.
Curated OER
Quantitative Data
For this quantitative data worksheet, pupils compute measures of central tendency, draw vertical line diagrams, and compare collected data. This 23-page worksheet contains approximately 100 multi-step problems. Explanations and examples...
Actis
Handling Data: Probability, Tree Diagrams
Clean, but captivating, two online simulations demonstrate probability for middle schoolers. They can choose the number of coins and tosses and watch as the results pile up. They can choose from a variety of spinner types and the number...
Curated OER
Presentation of Quantitative Data- Vertical Line Diagrams
In this quantitative data worksheet, students examine how vertical line diagrams can be used to display discrete quantitative data. They read about the use of tally charts to create vertical line graphs that display the data. They...
Noyce Foundation
Ducklings
The class gets their mean and median all in a row with an assessment task that uses a population of ducklings to work with data displays and measures of central tendency. Pupils create a frequency chart and calculate the mean and median....
Achieve
False Positives
The test may say you have cancer, but sometimes the test is wrong. The provided task asks learners to analyze cancer statistics for a fictitious town. Given the rate of false positives, they interpret the meaning of this value in the...
Concord Consortium
Stocking the Shelves
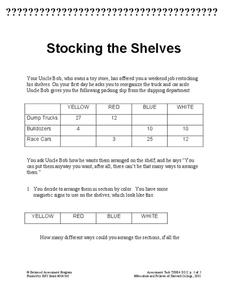
How many ways can you stock a shelf? It's probably more than you think! Young scholars use data in a frequency table to determine how many ways to stock a shelf given a specific constraint for types of groups. They then repeat the task...
Curated OER
Tally Chart Practice
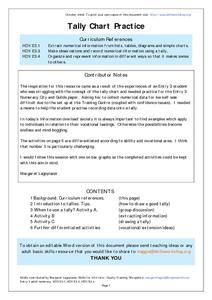
In this tally chart worksheet, students will read about tally charts and their uses. Kids will make a list of when and why they could make a tally chart. Next students will complete a tally chart and write statements about the...
Curated OER
The Photoelectric Effect in Photocells
Illuminate your physics class with this examination of a photovoltaic cell. Teach the structure and operation of the device using a diagram. Then make a human-powered, larger-than-life sized model of a PV cell. Learners become electrons...
Curated OER
Color, Light, and Excited Electrons
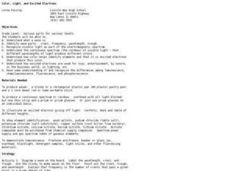
Investigate color, light and excited electrons and produce waves using slinkys. Your high schoolers will observe a continuous spectrum with a prism and an overhead projector. They observe flame tests to identify elements and they observe...
Curated OER
Typical Conceptual Questions for Physics I - Waves, Electricity, and Magnetism
This wave and electromagnetism assignment is so thorough, it could be used as a unit exam. The first section of it covers wave concepts. The next section addresses static electricity. There is a section that deals with electric circuits....
California Department of Education
What Is a "Wave"?
Take a stretch, but don't wave goodbye. An interesting resource provides everything needed to present an introductory lesson plan on waves. Teachers present a PowerPoint defining the types of waves and their characteristics. Pupils use a...
Curated OER
Regents High School Examination - Physics 2010
Give every type of learner in your physics class an opportunity to demonstrate what they have learned throughout the year. From analyzing tables and graphs, to evaluating diagrams and solving problems, there is an outstanding variety of...
Curated OER
Typical Conceptual Questions for Physics I - Light and Quantum
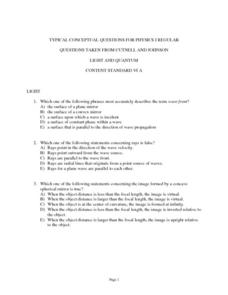
This is a stellar overview of everything light and quantum! There are 30 multiple choice questions, none of them requiring any mathematical computation. There are a few diagrams to analyze: light rays striking reflective and refractive...
Curated OER
Color at Light Speed
Rainbow science anyone? learners put the color specturm, frequency, light waves, and wavelengths into a light speed context. They use algebraic formulas to determine the speed of each light wave length. A great way to connect math and...
Curated OER
Probabilities for Number Cubes
Students explore the concept of probability. In this probability lesson, students roll a six-sided number cube and record the frequency of each outcome. Students graph their data using a frequency chart and keep tally marks in a...
Virginia Department of Education
Organizing Topic: Probability
The probability is high learning will occur! A well-designed unit introduces learners to the concepts of independent, dependent, and mutually exclusive events. Using Venn diagrams, the lessons ask learners to analyze many different...


