Math Worksheets Land
Pie or Circle Graphs Problems - Independent Practice Worksheet
Third graders take a set of data and turn it into a pie graph with an independent worksheet. Containing 10 sets of data, the resource reinforced data analysis skills that pupils can use throughout a graphing unit.
Curated OER
Pies and Percentages--Learning About Pie Graphs
In this pie graph worksheet, students draw a pie graph for the zookeeper with the data he collected, choose a different color for each animal species and make a key to the graph.
Curated OER
Interpreting Circle Graphs
What does this pie chart mean? Once scholars can analyze a circle graph on a basic level (i.e. "Most people prefer cats"), it's time to delve deeper into it. They examine two graphs here, and are given the total number of participants...
Willow Tree
Circle Graphs
Pie isn't just for eating! Scholars learn to create pie charts and circle graphs to represent data. Given raw data, learners determine the percent of the whole for each category and then figure out the degree of the circle that percent...
Curated OER
Fraction Circles
In this fraction circles worksheet, students examine 4 fractions circles separated into pie-shaped fraction tenths. The unlabeled charts can be used in a variety of classroom activities.
Curated OER
Pie Graph
Fifth graders examine fractional parts of pie graphs. Given a bag of M&Ms, 5th graders interpret the data. They use a paper plate and colors to create a graph of the types of M&Ms represented.
Curated OER
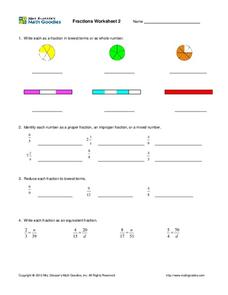
Fractions: pie graphs, numbers, and bars
In this fraction worksheet, students complete fraction problems containing pie graphs, numbers, bars, proper fractions, lowest terms, and more. Students complete 19 problems.
Curated OER
My Test Book: Reading Pie Charts
In this math skills worksheet, students solve 9 multiple choice math problems that require them to read and interpret charts. Students may view the correct answers.
Math Moves U
Collecting and Working with Data
Add to your collection of math resources with this extensive series of data analysis worksheets. Whether your teaching how to use frequency tables and tally charts to collect and organize data, or introducing young mathematicians to pie...
Math Mammoth
Multiplying Fractions by Fractions
A four-page resource walks learners through the basics of multiplying fractions. The handout is very visual with many diagrams in various colors. By the end of the lesson, learners are given an opportunity to multiply whole numbers with...
Curated OER
7th Grade Math Circle Graphs
Seventh graders are able to develop (synthesis) pie graphs with the class and on their own. They are told that pie charts are a graphic representation of material that can be given in the form of parts of a whole by using...
Curated OER
Creating Pie Graphs Using Percents
Sixth graders examine how to convert fractions to percents and percents to fractions. They list their activities for a 24 hour period, and create a pie graph using Microsoft Works.
Curated OER
Counting And Graphing
Learners explore counting and graphing. In this math lesson plan, students practice counting from 1-25 and are exposed to two types of graphs: the pie graph and the bar graph. Learners use Skittles to represent a variety of measurements.
Curated OER
Circle Graph-Fractions
In this circle graphs worksheet, students determine what fraction of a pie graph is a designated color. Answers are included on page 2.
Curated OER
Problem-Solving Decisions: Choose the Operation: Problem Solving
In this math operations worksheet, learners solve the word problem using the pie chart and following the steps of understand, plan, solve, and look back. Students then answer a final question by choosing the operation and solving.
Curated OER
Let's Go Shopping
In this fraction and pie chart worksheet, students draw a line from the toys with the prices of 50 cents, 75 cents, and 25 cents to the pie chart that show the part of a dollar the toy costs.
Curated OER
Collecting Data
In this data collection worksheet, students read about how data is collected and organized. They also learn about a hypothesis. Students read through examples of different charts and then answer 23 questions pertaining to data...
Curated OER
Fractions: Pie
Learners use a pie (circle) to study fractions. They create their own fraction problems and demonstrate to their classmates how to solve the problems. They discuss ways they use fractions in their daily lives.
Curated OER
Handling Data: Comparing Distributions
Middle schoolers gather information by analyzing graphs, diagrams and pie charts. In this graphs and diagrams lesson, students complete addition and subtraction problems. Middle schoolers discuss a pie chart. Students use information to...
Curated OER
Changing Fractions: Worksheet 1
In this math worksheet, students first write the fraction of the shaded area on the circles. Students then draw lines connecting markers on the perimeter of the circle and write the fraction using the new fraction that is shown.
Curated OER
Thinking About Technology: What Is It? How Can It Help Us?
What is technology and how can it help us? Using a instructional activity, students read a list and choose practical applications of scientific knowledge, brainstorm examples of home, school and hospital technology, graph answers in a...
Curated OER
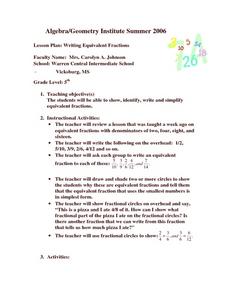
Writing Equivalent Fractions
Fifth graders work to find the fractions that are equal to one another. They use a visual pie graph to show different values. Students are able to see how fractions can look different, yet have the same value.
Curated OER
Fractions: Add and Subtract
In this fractions activity, students count the spare change they have at home and complete a chart, filling in coin values, number they have and total value for each. Students then represent the make a pie chart to represent fractions of...
Curated OER
Percent Notation
In this algebra worksheet, students divide circles into equal portions as they explore percents and decimals. They convert between decimals and fractions using ratio and proportion. There are 8 questions.


