Curated OER
Disperse or Decrease
Students explore the dispersal of animals.. Students take on the role of a specific animal. They simulate finding a new home due to overpopulation. Through hands-on activities performed during the simulation, students discover the area...
Curated OER
Clouds and the Earth's Radiant Energy System
Wow! What a lesson plan! Six terrific activities are described in great detail, in this 31-page document! Learners will model and explain cloud formation, sketch and identify certain cloud types, calculate and compare incoming and...
Consortium for Ocean Science Exploration and Engagement (COSEE)
Plankton to Penguins: Antarctic Food Web
A well-written lesson plan, second in a series of four, gets high schoolers exploring how the Antarctic food web is impacted by climate change and the associated melting of polar ice sheets. It begins with a PowerPoint presentation about...
American Chemical Society
Condensation
It's time to break the ice! If you are doing all of the lessons in the unit, children have already seen that increasing heat increases the rate of evaporation, but is the opposite true? Does decreasing temperature cause more condensation...
Mental Health Literacy
Mental Health and High School Curriculum Guide - Version 3
A 171-page curriculum provides educators with the information they need to help and support high schoolers' mental health. The curriculum targets five domains: learning how to maintain good mental health, learning about mental disorders...
Curated OER
Supply and Demand: Ch 3
Economic supply and demand based on comparative data is the topic of this work packet. Intended for learners in grades twelve or higher, this set of exercises will challenges them to use their data analysis skills in a real-world...
Willow Tree
Percent of Change
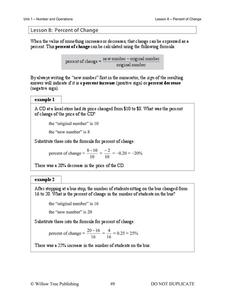
Your car decreases in value from $20,000 to $17,000. What percent of the value have you lost? Pupils answer word problems by determining the percent of change.
Curated OER
Graphing Exponentials
Bring your Algebra class to the computer lab! Using materials created by Texas Instruments, they explore exponentiasl and graphs. Be sure to download the correct materials (on the right side of the webpage) before having them walk...
DK Publishing
Counting Caterpillars
These caterpillars each have a number sequence printed on their segmented bodies, but some numbers are missing! Look at the completed caterpillars as an example, asking kids to notice a possible pattern. They should observe that the...
Balanced Assessment
Stock Market
Analyze trends in the stock market using histograms. Future economists use data presented in a histogram to find periods of greatest increase and decrease. They also draw conclusions about days that would be best to invest.
Curated OER
The Environment
Students explore the issues that influence our environment and research ways to decrease the negative impact that humans have on the environment. Misconceptions about environmental issues are addressed in this lesson.
Curated OER
Speed Score
A fast and fun way to practice shooting basketball. Small cooperative groups help each other tally up the most baskets made in a certain period of time. There are a couple ideas included to increase or decrease the difficulty of the...
Curated OER
Graphical Analysis
Get out your TI-nspire graphing calculator and explore polynomials. Learners determine where a given polynomial are increasing or decreasing, find maximums, minimums, and zeros of polynomials, and discuss end behavior of polynomials....
Curated OER
Finding Patterns
What's the pattern? Learners skip count to complete 12 sequences, some of which increase and some of which decrease. As they solve each number pattern they count by 2, 3, 4, 5, 6, 10, and 100, getting some extra subtraction and addition...
Learning to Give
We Can Help to Make a Change!
The importance of accepting those who are different is the subject of a service learning project. Upper graders craft presentations for younger learners on ways to include everyone in the school community and to decrease the feelings of...
Curated OER
Carnival Tickets
A great subtraction and division discovery opportunity for young mathematicians, this learning task involves seven word problems that require multiple steps. Learners use a math table to persevere in solving problems that are supported...
Polar Trec
Temperature Profile above the South Pole
Collecting and understanding data is a big part of understanding the world and how it changes. To better grasp what temperatures are changing and how they affect global populations, learners create a graph based on the date provided....
Curated OER
Heart Rate Monitoring
Algebra learners like this resource because it is easy to understand and it relates to their lives. Whether you are starting a new workout routine, or just climbing the stairs, your heart rate increases and decreases throughout the day....
Federal Reserve Bank
Deflation: Who Let the Air Out?
Why do decreasing prices (deflation) restrain economic growth, and why is this a real concern? Here you'll find reading materials and a related instructional activity that gets right to the heart of this question, using recent events and...
Charleston School District
Contextualizing Function Qualities
Let the graph tell the story! Adding context to graphs allows learners to analyze the key features of the function. They make conclusions about the situation based on the areas the graph is increasing, decreasing, or has a maximum or...
EngageNY
Interpreting the Graph of a Function
Groups sort through NASA data provided in a graphic to create a graph using uniform units and intervals. Individuals then make connections to the increasing, decreasing, and constant intervals of the graph and relate these connections...
Curated OER
Understanding the Cosmic Microwave Background (CMB)
How did our universe really begin? Explore the Science Big Bang Theory and Cosmic Microwave Background (CMB) with this multiple activity-based lesson that demonstrates that the increase of density due to the decrease of temperatures,...
Colorado State University
If Hot Air Rises, Why Is it Cold in the Mountains?
Investigate the relationship between temperature and pressure. Learners change the pressure of a sample of air and monitor its temperature. They learn that as air decreases its pressure, its thermal energy converts to kinetic energy.
Curated OER
Percent of Change
In this percent of change worksheet, students calculate the change in two whole numbers. They compute the percent of change and indicate if it is an increase or decrease.


