Next Gen Personal Finance
Next Gen Personal Finance: Managing Credit Data Crunch
Data Crunches feature one chart or graph followed by five scaffolded questions to guide students through analyzing the data and drawing conclusions. These sets of data help students understand financial concepts.
Next Gen Personal Finance
Next Gen Personal Finance: Saving Data Crunch
Data Crunches feature one chart or graph followed by five scaffolded questions to guide students through analyzing the data and drawing conclusions. These sets of data help students understand financial concepts.
Next Gen Personal Finance
Next Gen Personal Finance: Checking Data Crunch
Data Crunches feature one chart or graph followed by five scaffolded questions to guide students through analyzing the data and drawing conclusions. These sets of data help students understand financial concepts.
Next Gen Personal Finance
Next Gen Personal Finance: Career Data Crunch
Data Crunches feature one chart or graph followed by five scaffolded questions to guide students through analyzing the data and drawing conclusions. These sets of data help students understand career concepts.
Next Gen Personal Finance
Next Gen Personal Finance: Insurance Data Crunch
Data Crunches feature one chart or graph followed by five scaffolded questions to guide students through analyzing the data and drawing conclusions. These sets of data help students understand insurance concepts.
Next Gen Personal Finance
Next Gen Personal Finance: Taxes Data Crunch
Data Crunches feature one chart or graph followed by five scaffolded questions to guide students through analyzing the data and drawing conclusions. These sets of data help students understand tax concepts.
Next Gen Personal Finance
Next Gen Personal Finance: Financial Pitfalls Data Crunch
Data Crunches feature one chart or graph followed by five scaffolded questions to guide students through analyzing the data and drawing conclusions. These sets of data help students understand financial concepts.
Next Gen Personal Finance
Next Gen Personal Finance: Budgeting Data Crunch
Data Crunches feature one chart or graph followed by five scaffolded questions to guide students through analyzing the data and drawing conclusions. These sets of data help students understand financial concepts such as budgeting.
Annenberg Foundation
Annenberg Learner: Making a Stem and Leaf Plot
A line plot may not be a useful graph for investigating variation so we must come up with a new representation based on groups of data. Construct a stem and leaf plot from a set of 26 data values.
Khan Academy
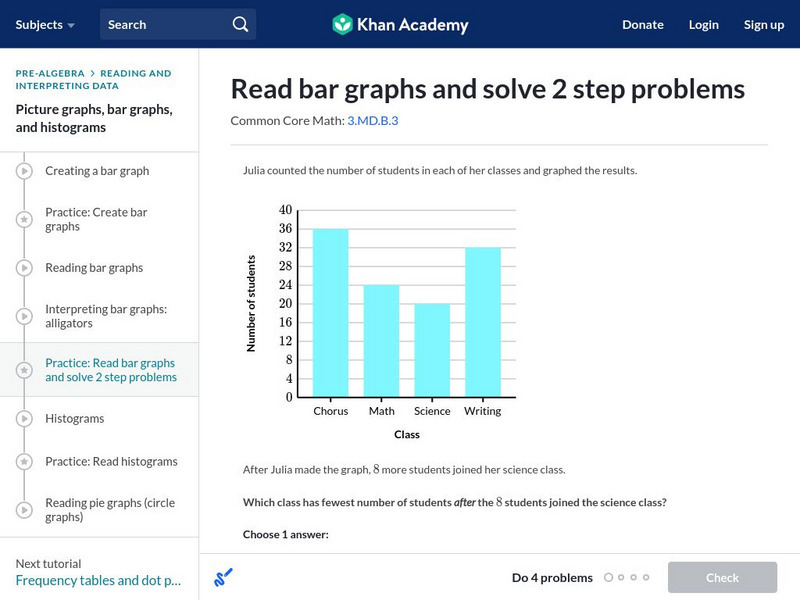
Khan Academy: Read Bar Graphs and Solve 2 Step Problems
Read and interpret a double bar graphs. Students receive immediate feedback and have the opportunity to try questions repeatedly, watch a video or receive hints. CCSS.Math.Content.3.MD.B.3 Draw a scaled picture graph and a scaled bar...
Alabama Learning Exchange
Alex: M&m's and Blogs: Interpreting Data!
In this hands-on, technology-rich lesson, students will interpret data. The students will define words involving graphs, create a bar graph using M&M's, and post information from their findings on the internet. The students will also...
Discovery Education
Discovery Education: Science Fair Central: Investigation Set Up and Collect Data
A brief overview of how to gather both quantitative and qualitative data, complete with a sample data table.
Better Lesson
Better Lesson: Graphing With M&m's
M&M's can be used to create a unique data set and can be graphed by students
Oswego City School District
Regents Exam Prep Center: Scatter Plots and Line of Best Fit
Use this lesson, practice exercise, and teacher resource in planning instruction on scatter plots and line of best fit. In the lessons, you'll find definitions and examples of ways to make a scatter plot, determine correlations, and find...
TeachEngineering
Teach Engineering: Forces and Graphing
This activity can be used to explore forces acting on an object, to practice graphing experimental data, and/or to introduce the algebra concepts of slope and intercept of a line. A wooden 2x4 beam is set on top of two scales. Students...
Other
University of Wisconsin Green Bay: Faults and Earthquakes
This site is primarily set up as an outline and is loaded with graphs, maps, and images. It covers a variety of earthquake-related topics, such as what causes earthquakes, fault lines and structures, seismology, a historical look at...
Alabama Learning Exchange
Alex: Statistically Thinking
The object of this project is for students to learn how to find univariate and bivariate statistics for sets of data. Also, the students will be able to determine if two sets of data are linearly correlated and to what degree. The...
National Council of Teachers of Mathematics
Nctm: Illuminations: Line of Best Fit
Use this activity to practice how to enter a set of data, plot the data on a coordinate grid, and determine the equation for a line of best fit.
CK-12 Foundation
Ck 12: Algebra: Identification of Quadratic Models
[Free Registration/Login may be required to access all resource tools.] This lesson covers fitting a data set to a quadratic equation.


