Illustrative Mathematics
Comparing Years
Who knew that the Egyptian, Julian, and Gregorian year were different lengths? Your mathematicians will! They will have to calculate the difference between the years in seconds and find the percent change. Using dimensional analysis,...
Curated OER
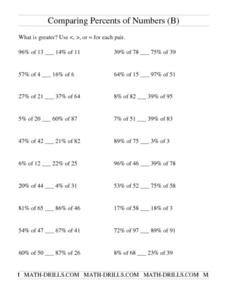
Comparing Percents of a Number
In this comparing percents worksheet, students solve 22 problems in which two percents of numbers are compared using the <, >, or = sign. Example: 60% of 50 and 87% of 26. There is not room on the paper for calculations.
Curated OER
Figuring and Comparing Percents
In this figuring and comparing percents learning exercise, students solve 4 problems by figuring out the percents of two numbers and comparing them.
Scholastic
Study Jams! Decimal, Fraction, & Percent Equivalents
If percents, fractions, and decimals can all mean the same number how do we go from one to another? During this instructional activity, watch how it goes over the basic steps needed to go from one rational number to the next. Both...
Curated OER
Representing Fractions, Decimals, and Percents
In this fractions, decimals, and percents lessons, students explore various methods of representing fractions. They demonstrate situations that represent rational numbers. Students create a foldable exploring fractions, decimals and...
Curated OER
Our Solar System - Comparing Planetary Travel Distances
NASA presents a mini-unit on distances in our solar system. It incorporates scientific concepts of gravity, mass, density, and payload while your aspiring astronauts also employ mathematics skills. They calculate speed, they determine...
Curated OER
Ratios, Rates, Percent and Nutrition
Examine food labels to determine percentage of fat and sugar to total calories with middle schoolers. Daily nutritional guidelines are discussed and learners will decide how well their foods fit into a healthy diet. In the provided...
Curated OER
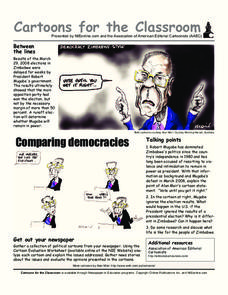
Cartoons for the Classroom: Comparing Democracies
Could a president just ignore election results? In this analysis handout, scholars consider this question as they read background information on the 2008 elections in Zimbabwe. Two political cartoons poke fun at President Robert Mugabe,...
Scholastic
Study Jams! Compare Money Amounts
Elementary money makers are walked through five steps to compare two different amounts. RJ speaks slowly as animations display his explanations. He compares the price of a New York magnet to the amount of money his cousin has on hand to...
EngageNY
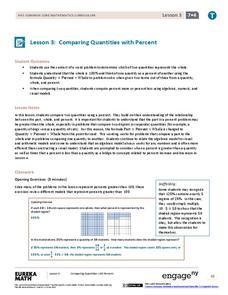
Comparing Quantities with Percent
Be 100 percent confident who has the most and by how much. Pupils use percentages to help make the comparisons by finding what percent one quantity is of the other. They also determine the percent differences between the two quantities.
Illustrative Mathematics
The Price of Bread
As part of an initiative to strengthen our young adults' financial understanding, this problem explores the cost of bread and minimum wage since the 1930s. Learners are asked to find the percent increase from each year and compare it...
Curated OER
Compare Percent and Decimals
In this comparing percents and decimals activity, students complete 5 problems comparing and writing which is more. Work space and answers are provided.
Noyce Foundation
Percent Cards
Explore different representations of numbers. Scholars convert between fractions, decimals, and percents, and then use these conversions to plot the values on a horizontal number line.
Curated OER
Fractions, Decimals and Percents
Students investigate the differences when using decimals, fractions, and percents. They focus on the process of using them in real problems and how to convert them from one form to another.
Curated OER
Family Activity - Color by Numbers: Fractions, Decimals, and Percents
Learners solve four short answer problems. They determine the number of each color of candy or paper clip in a bag, and calculate the fractional, decimal, and percentage representation of the color compared to the total number of items.
Curated OER
Student Exploration: Fraction, Decimal, Percent
Students explore the concept of fractions, decimals, and percents. In this number sense lesson, students use a worksheet to guide them through the exploration of the relationship between fractions, decimals, and percents. Students work...
Curated OER
Compare Percent and Decimal
In this percents and decimals worksheet, students compare the percents of a number to a decimal and decide which is more. Students complete 5 problems.
Curated OER
Comparing Apples With Apples 1
Elementary schoolers observe and demonstrate how to add and subtract fractions with like denominators. They observe the teacher model a variety of fraction addition and subtraction problems and use fraction strips to complete a worksheet.
Louisiana Department of Education
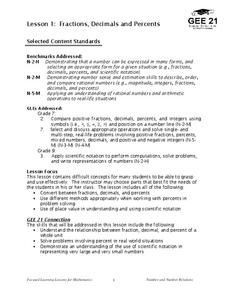
Fractions, Decimals, and Percents
Fractions, decimals, and percents all say the same thing! Show your classes how to convert between the three forms using visual and numeric representations. Then lead them to an understanding of scientific notation.
Virginia Department of Education
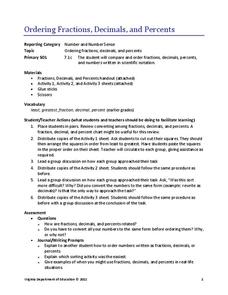
Ordering Fractions, Decimals, and Percents
Order up a resource on comparing rational numbers. Scholars order fractions, decimals, and percents by converting to a single form. They conduct a cut-and-paste activity ordering three sets of rational numbers.
EngageNY
Part of a Whole as a Percent
Pupils use visual models, numeric methods, and equations to solve percent problems. To complete the second installment of 20, they find the part given the percent and the whole, find the percent given the part and the whole, and find the...
EngageNY
Solving Percent Problems
Don't discount how much your pupils understand percents! The 27th lesson in a series of 29 presents a problem to find the cost of a discounted outfit. Small groups determine either the original price or the discount received given the...
Math Worksheets Land
Percent Error and Percent Increase - Step-by-Step Lesson
Half a foot difference may not mean much, but converting that to an 8% change puts it into perspective for young minds. The lesson discusses the idea of converting information into percents to discover errors made and how much it...
EngageNY
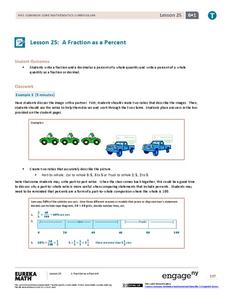
A Fraction as a Percent
It is all about being equivalent. Class members convert between fractions, decimals, and percents. By using visual models, scholars verify their conversions in the 25th portion of a 29-part series.


