NOAA
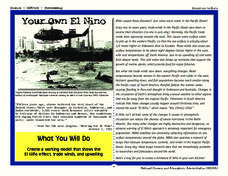
Your Own El Nino
Scholars make a model to discover how the force of trade winds over the Pacific Ocean creates an El Niño. Super scientists observe how the severe weather affects life in water and on land.
Colorado State University
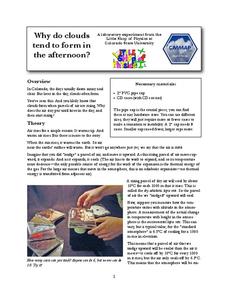
Why Do Clouds Form in the Afternoon?
The stability of the atmosphere changes on a daily basis. A kinesthetic lesson models how the stability of the air changes as it's warmed by the sun. Learners connect their models to the changing air currents and movement of warm and...
NASA
Freshwater Availability Classroom Activity
This science assignment produced by NASA teaches inquiring minds the distribution of Earth's water. Learners will appreciate and understand the importance of fresh water and how weather and climate affects everything.
Curated OER
Weather and Climate
Students explore all the facets about weather and analyze how weather and climate are connected through time. They consider how weather changes and the effects of weather on the present state of the Earth's climate. Alterations to our...
Curated OER
Analysis of Atmospheric Conditions for a High Mountain Retreat
Students examine the relationship between altitude, atmospheric pressure, temperature and humidity at a particular location. They practice science and math in real world applications. They write reports detailing their scientific...
Curated OER
Weather Anomalies
Ninth graders participate in a simulation of a select scientific team from the National Oceanic and Atmospheric Administration (NOAA).
Curated OER
Air Pressure
Students design and use a barometer to study air pressure. In this weather instructional activity, students identify the causes of air pressure. They design and use a barometer to determine how air pressure relates to air temperature and...
Curated OER
Weather, Data, Graphs and Maps
Students collect data on the weather, graph and analyze it. In this algebra instructional activity, students interpret maps and are able to better plan their days based on the weather reading. They make predictions based on the type of...
Curated OER
Weather Review
In this weather worksheet, students reviews terms associated with measuring different weather phenomena plus draw examples of different types of fronts on a weather map. This worksheet has 5 true or false, 15 matching, 21 multiple...
Curated OER
The Weather Classroom: Atmosphere
Middle schoolers explore the planets and their atmospheres online. They write the story of "Goldilocks and the Nine Planets" to explain how each planet's atmosphere differs from Earth's. They design a viable life form.
Curated OER
How Do They "Whether" the Weather
Sixth graders are engaged in learning about weather systems, weather patterns and how to create a local forecast through a KCTS video called: "How Do They "Whether" the Weather?" Students actively learn how movements in atmosphere are...
Curated OER
Weather Folklore
In this weather worksheet, students decode the given "weather lore" using the code provided. Students must decode 7 different statements.
Curated OER
Tracking the Weather Using Technology
Fourth graders explore the use of technology to monitor and forecast weather. They investigate the different types of weather monitoring and forecast tools. Students interpret radar images and discuss the traditional types of weather...
Curated OER
Forecasting Weather
For this weather worksheet, students review the different things a meteorologist studies and how they collect weather data. Students compare weather watch and weather warning. This worksheet has 10 matching and 3 short answer questions.
Curated OER
Wild Weather Vocabulary Review
For this weather vocabulary worksheet, students are given 15 weather word definitions, and determine each word that is defined. A reference web site is given for additional activities.
Curated OER
Water Cycle, Weather, and Climate
Eighth graders investigate the water cycle and its processes. They examine temperature and precipiation data to classify climate of ten cities. They then create a climate map of the world.
Curated OER
How Much Water Is Available In The Atmosphere For Precipitation?
Students explore the relationship between the available water in the atmosphere and how it is portrayed on satellites. After examining global moisture and precipitation students research precipitation data graph the results. Using their...
Curated OER
Weather, Sea Level Rise and Climate Change Course
Learners explain the impact of glacial melting to global climate change. In this environmental science lesson, students design an experiment to investigate the effect of salinity change to melting glaciers. They share their results to...
Curated OER
The Fabled Maine Winter
Students graph and analyze scientific data. In this research lesson students use the Internet to obtain data then draw conclusions about what they found.
Super Teacher Worksheets
Types of Clouds
What's the term for clouds that look like fluffy cotton balls? What about thick, gray clouds? Learn the names and descriptions for each type of cloud with a worksheet and activity. Learners read four columns of high-level, mid-level,...
NASA
The Big Climate Change Experiment Lesson 3: Climate Change Lines of Evidence
Consider the preponderance of evidence when making a verdict. The third of five lessons in Unit 1: The Big Climate Change Experiment focuses on the evidence for climate change. Learners study graphs, diagrams, and pictures regarding...
PBS
Regional Patterns of Climate: Pacific Northwest
Climate systems involve sunlight, ocean, atmosphere, ice, land forms, and many other factors. Scholars explore each of these variables related to the Pacific Northwest rain forest. They use an online interactive to investigate the polar...
Curated OER
Beary O'Mometer Learns About Careers In Meteorology
Students explore the field of meteorology. In this meteorology lesson, students explore weather-related careers as they research the field of study as well as various weather concepts. Students interview meteorologists, write business...
Curated OER
Cloudy vs. Clear
Learners analyze line plots. In this weather lesson plan using real NASA data, students discuss how weather affects the way the Earth is heated by comparing different line plots.


