Curated OER
Introduction to Representing and Analyzing Data
Represent data graphically. Allow your class to explore different methods of representing data. They create foldables, sing songs, and play a dice game to reinforce the measures of central tendency.
Curated OER
Lesson #46: Bar Graphs and Line Graphs
In this bar graphs and line graphs instructional activity, students interpret bar graphs, line graphs, and box-and-whisker plots. They find the measures of central tendency. This three-page instructional activity contains notes,...
Curated OER
Leveled Problem Solving: Range and Outliers
In this range and outliers worksheet, students solve 6 word problems where they examine data then identify outliers, find the upper and lower quartile ranges, find the interquartile range and create box-and-whisker plots.
Centre for Innovation in Mathematics Teaching
Ten Data Analysis Activities
This thirteen page data analysis worksheet contains a number of interesting problems regarding statistics. The activities cover the concepts of average measurements, standard deviation, box and whisker plots, quartiles, frequency...
Curated OER
Super Ticket Sales
Use this graphing data using box and whisker plots lesson to have learners make box and whisker plots about ticket sales of popular movies. They find the mean, median, and mode of the data. Pupils compare ticket sales of the opening...
Curated OER
Mathematical Modeling
Study various types of mathematical models in this math lesson. Learners calculate the slope to determine the risk in a situation described. They respond to a number of questions and analyze their statistical data. Then, they determine...
Illustrative Mathematics
Puppy Weights
Nobody can say no to puppies, so lets use them in math! Your learners will take puppy birth weights and organize them into different graphs. They can do a variety of different graphs and detail into the problem based on your classroom...
Curated OER
Box and Whiskers
Middle schoolers discover how to relate collected data with a box and whiskers graph in a number of formats. They collect, organize, create, and interpret a box and whiskers graph. Pupils interpret the difference between sets of data,...
Curated OER
Data Analysis
In this data analysis worksheet, learners solve and complete 6 different problems that include using various types of data analysis. First, they create a stem-and-leaf plot of the ratios shown at the top and determine the mean, median,...
Curated OER
Statistics
Seventh and eighth graders solve and complete three various types of problems. First, they find the median rate using the box-and-whisker plot shown. Then, learners describe the inter-quartile range. In addition, they determine whether...
Curated OER
Interpreting and Displaying Sets of Data
Students explore the concept of interpreting data. In this interpreting data activity, students make a line plot of themselves according to the number of cubes they can hold in their hand. Students create their own data to graph and...
Curated OER
Analyzing Graphs
In this statistics and probability worksheet, students analyze frequency distribution tables or histograms and box and whisker plots. The two page worksheet contains four multiple choice questions. Answers are included.
Curated OER
Analyze and Interpret Statistical Information
In this probability and statistics activity, 9th graders analyze and interpret histograms as they identify trends in the data. The two page activity contains four problems. Answers are provided.
Curated OER
Dealing with Data
Seventh graders collect and analyze data. In the seventh grade data analysis lesson plan, 7th graders explore and/or create frequency tables, multiple bar graphs, circle graphs, pictographs, histograms, line plots, stem and leaf plots,...
Curated OER
Eat Your Veggies
Students investigate displaying data. In this displaying data activity, students use tallies to count data about food preferences. Students use various types of graphs such as bar graphs, picture graphs, box-and-whisker plots, etc to...
Texas Instruments
Light and Day
Pupils explore the concept of collecting data as they collect data on their graphing calculator about time, temperature, and light. Learners plot the data and create histograms and box and whisker plots to analyze the data.
Curated OER
comparison of Two Gender Sports Teams
Young scholars gather data on sports team and create a box and whisper plot. In this data collection lesson, students find the median, the quartile range, and relationships between variables.
Curated OER
Statistics - Central Tendency
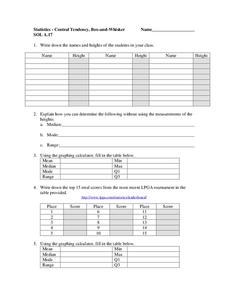
In this statistics worksheet, students solve and complete 13 different problems that include creating various box-and-whisker plots. First, they write a definition for mean, median, mode and range. Then students explain how to determine...
Curated OER
Measures of Central Tendency
In this measures of central tendency worksheet, students solve and complete 6 different problems. First, they count the number of items in each set of data. Then, students determine the mean, median and mode for each. In addition, they...
Curated OER
Central Tendency
For this central tendency worksheet, students solve and complete 10 different problems that include measures of central tendency. First, they write down the names and heights of students in their class. Then, students explain how they...
Curated OER
Statistics
In this statistics activity, 9th graders solve and complete 10 various types of multiple choice problems. First, they determine the mean number of miles per day that were completed. Then, students determine the data set that has a median...
Curated OER
Statistics
In this statistics activity, students solve and complete 6 different problems that include determining various types of statistics. First, they determine the data set where the median value is equal to the mean value. Then, students use...
Curated OER
Box-and-Whisker Plots
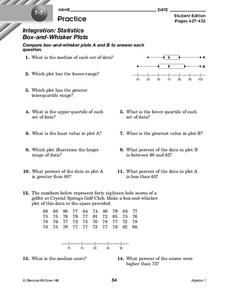
In this box-and-whisker plots worksheet, 9th graders solve and complete 14 different problems that include comparing various box-and-whisker plots. First, they determine the median for each set of data and plot the lesser range. Then,...
Curated OER
Statistics
In this statistics instructional activity, 9th graders solve and complete 10 various types of problems that include using different types of graphs to illustrate data. First, they determine the median score for each stem-and-leaf plot....


