Curated OER
A Picture is Worth a Thousand Words: Introduction to Graphing
Students practice graphing activities. For this graphing lesson, students discuss ways to collect data and complete survey activities. Students visit a table and graphs website and then a create a graph website to practice graphing.
Curated OER
Best-Selling Books Bar Graph
Students fill in bar graphs to show ten of the best-selling students' books of all time. Students create simple bar graphs to show how many copies of each of the ten books have been sold.
Curated OER
Graphs that Represent Data Sets
Use these pre-made data sets to introduce kids to bar graphs and data analysis, and then have them take surveys on their own. There are 10 survey scenarios written out here, and scholars synthesize the results of each into a bar graph....
Curated OER
Graphs to Represent a Data Set
Here are a some pre-made sets of data that kids can use to practice data analysis. There are 10 survey scenarios written out, and scholars synthesize the results of each into a bar graph. In addition to the graphing, they answer two...
Curated OER
Organizing Data
In this data worksheet, students convert measurements to significant notation and determine the number of significant digits. This worksheet has 4 fill in the blank and 2 short answer questions.
Curated OER
Use a Graph
Information is often presented in graph form. Can your youngsters read a basic bar or picture graph? Six word problems accompany three graphs. One graph is a bar graph and the other two are pictographs.
Curated OER
Choose a Graph to Display Data
In this math graphs worksheet, students write line plot, tally chart, pictograph, or bar graph to tell the best kind of graph to use to answer the six questions.
Curated OER
Math--Pictures and Bars--Learning About Graphs
What is a graph? What does it tell us? How do you make one? These are all questions that are answered in the included packet. It's a great introduction to graphing for young learners!
Curated OER
Interpreting Data from Birdfeeders
What kinds of birds live in your area? Read a book about birds to your learners and explore their feeding patterns. Charts and graphs are provided in this three page packet, but consider assigning the basic questions if using with young...
Curated OER
Learning to Read Graphs 2
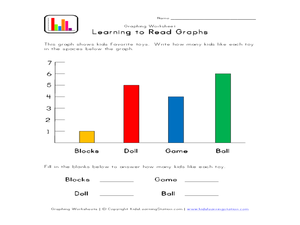
Do you like playing with blocks, dolls, games, or balls? Use this basic graph to review bar graphs with young learners. After completing the four questions below, consider creating your own class graph: who likes blocks the best? Who...
Curated OER
Learning to Read Graphs
What is your favorite pet? This is a great tool for youngsters just learning how to read and interpret graphs. There are four simple questions. Consider extending this activity by creating a class bar graph: how many learners have a dog,...
Curated OER
Tim and Pat at the Store: Bar Graphs
Do you like candy? Tim and Pat go to the candy store every day after school. Can you use the chart to determine how much money they spend each day? Does one spend more than the other?
Curated OER
Curious Clouds
Second graders explore clouds. They read The Cloud Book by Tomie dePola. Students sort the cloud pictures into three categories. Students create a graph using the cloud pictures. They use Excel to create a bar graph.
Pennsylvania Department of Education
Use Order of Operations to Evaluate Expressions—No Grouping Symbols
Students identify and explain different types of data collection and graphs. In this graphs and data collection lesson, students record their observations of a variety of data collection tools and graphs displayed in the room. Students...
Curated OER
Graphing the Forecast-Line Graph or Bar Graph?
Students explore bar and line graphs. In this data collection, graphing, and weather instructional activity, students compare bar and line graphs and discuss which type of graph would be most appropriate for displaying a ten day weather...
Curated OER
Integrated Algebra Practice: Frequency Histograms, Bar Graphs and Tables
In this graphs activity, students solve 4 problems about histograms, bar graphs, and tables. Students answer questions about histograms, bar graphs, and tables.
Curated OER
5 Sense Bear
Students become familiar with their five senses through the creation of a sense bear. In this five senses lesson, students create a bear and add cinnamon and a candy cane to the bear. Students use their five senses with this bear...
Curated OER
Frequency, Histograms, Bar Graphs and Tables
In this frequency worksheet, students interpret histograms, bar graphs and tables. They examine frequency charts and comparison line graphs. This three-page worksheet contains 4 problems. Answers are provided on the last page.
Curated OER
Step Into My Shoes
Students order their classmates from smallest to largest foot length. In this ordering their classmates from smallest to largest foot length lesson, students trace each of their classmates foot. Students read a story called, 'How Big...
Curated OER
Bar Graphs
Third graders investigate bar graphs. In this third grade mathematics lesson, 3rd graders collect and analyze data and use the internet’s Graph challenge to create their own graphs. Students write questions for the other students to...
Curated OER
All About Graphs
Students practice organizing data by creating graphs. In this statistics instructional activity, students survey the class about favorite colors and create a bar graph using the data. Students complete a test based on pet and animal...
Curated OER
Statistics Problems
In this statistics worksheet, 3rd graders answer questions about different graphs including bar graphs, picture graphs, line graphs, and more. Students complete 20 multiple choice questions.
Curated OER
State Data
Students select ten states and use the number of letters in each state name as their data. For this measures of central tendency lesson, students find the mean, median and mode of the number of letters in their selected state names. They...
Curated OER
Histograms and Bar Graphs
Students examine the use of bar graphs and histograms. In this data representation lesson, students investigate the proper use of bar graphs and histograms to represent data. They learn the proper geometric definitions, experience direct...


