Curated OER
Surveying
Learners calculate angles and areas for a surveying project. They gather information and diagram a project. They identify and define surveying principles and terminology.
Curated OER
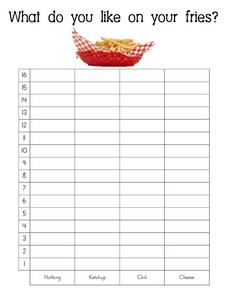
What Do You Like on Your Fries?-- Class Bar Graph
In this math worksheet, students participate in a group graphing activity. Students are surveyed about what they like on their fries: nothing, ketchup, chili or cheese. Results are plotted on a bar graph.
Curated OER
Would You Rather Have a Pet With Fur, Fins, Or Feathers? --Class Bar Graph
In this math worksheet, students participate in a group graphing activity. Students are surveyed about favorite types of pets: with fur, feathers or fins. Results are plotted on this class graph.
Curated OER
Do You Like Hamburgers Or Hot Dogs Better?-- Class Bar Graph
In this math learning exercise, students collaborate to complete a bar graph. Students are surveyed as to their preference for hot dogs or hamburgers. Results are plotted on a bar graph.
Curated OER
Floodplains in the Field
Students measure a topographic and geologic cross-section across a floodplain using simple surveying and auguring techniques in a field lab. Students also reconstruct the history of a river system.
Curated OER
Coordinates
High schoolers use cartesian coordinates (x,y,z) in 3-dimensional space. [Optional: appreciate there exist two ways of defining the z axis, and which of them is used.] They become familiar with the tools and terms used by surveyors.


