University of Wisconsin
Measuring Slope for Rain Gardens
The slope of the land is an important feature when considering the erosion that will occur. In this resource, which is part of a rain garden unit, learners calculate the slope of the proposed garden site. Even if you are not planning a...
Curated OER
Analyzing Equations Through Slope and Y-int
With problems applying to modern-day topics like Netflix and McDonald's, math whizzes analyze graphs and investigate the slopes. In this algebra worksheet, learners identify the slope and y-intercept of the given equations. They graph...
Curated OER
Scatter-Brained
Seventh graders graph ordered pairs on a coordinate plane. They create a scatterplot. Additionally, they determine the line of best fit and investigate the slope of the line. Multiple resources are provided. An excellent resource!
Illustrative Mathematics
Peaches and Plums
According to the resource graph, which costs more: peaches or plums? Algebra learners compare two proportional relationships and then throw in a banana. Leaving out the scale helps students become intuitive about graphing.
Illustrative Mathematics
Find the Change
This exercise is an opportunity for algebra learners to understand the connection between the slope of a line and points found on the line. Use similar triangles to explain why slope m is the same between any two points. Discuss with the...
Illustrative Mathematics
DVD Profits, Variation 1
The idea in the resource is to understand the connections between proportional relationships, lines, and linear equations. To stay within the context of the standard, skip the part of the resource that solves with unit rates. Instead,...
Illustrative Mathematics
Proportional Relationships, Lines, and Linear Equations
The resource is a good introduction to what makes a proportional relationship between two lines. Discuss the similarities of both lines and the possibility of intersection. Use this opportunity to list other acceptable forms of each...
Illustrative Mathematics
Comparing Speeds in Graphs and Equations
Compare two different proportional relationships on a graph. It is up to your mathematicians to determine which of two moving objects have greater speed. A good example of a Common Core multiple choice question.
Illustrative Mathematics
Coffee by the Pound
This is a great exercise in graphing proportional quantities to interpret the unit rate as the slope of a graph. It is not easy for learners to understand what a unit rate is. When it is presented as the slope of a linear line graph,...
Curated OER
Exercise Set 2.4: Equations of Lines
In this linear equations worksheet, students solve 36 linear equations. Students write equations of lines in slope intercept form given a graph, standard form, two points, and slope and a point.
Curated OER
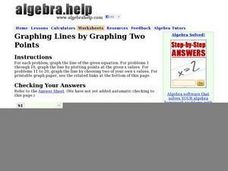
Graphing Lines by Graphing Two Points
Use a graphing lines activity to have your mathematicians graph the line of a given equation and plot specified points. The first 10 problems have a given equation, and two values. The next 10 problems have a given equation, but your...
Curated OER
Graphing Lines That Don't "Fit"
How can you graph lines that don't seem to fit on the given graph? What makes a line straight? What does the rate of change mean when graphing a line? How do you know if a slope is positive or negative? How do you know if the graph of a...
Curated OER
A Contouring We Go
Students examine the built environment and infrastructures of their community by constructing contour equipment, using the equipment, and comparing their results to current topographical maps of the same area
Curated OER
Hybrid Vehicles: Cut Pollution and Save Money
Math and science meet in this instructional activity on hybrid electric automobiles. This 24-page resource provides everything you need for teaching a instructional activity that compares the use of internal combustion engines to hybrid...
Curated OER
Slope, Vectors, and Wind Pressure
A hands-on lesson using the TI-CBR Motion Detector to provide information to graph and analyze. The class uses this information to calculate the slope of motion graphs and differentiate scalar and vector quantities. There is a real-world...
Curated OER
Stars and Slopes
More of a math lesson than physics or space science, high schoolers take a set of data and plot it on a log-log coordinate system. The write-up for day two was never completed, but day one, "Stars and Slopes," is complex and cohesive....
Curated OER
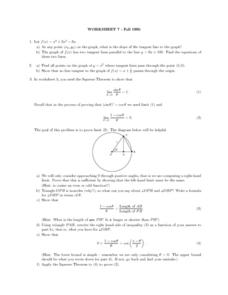
Worksheet 7: Slope and Tangents
Providing both review and practice problems, this worksheet prompts students to answer five questions having to do with slope, tangents lines, graphing, the Squeeze Theorem, differentiable functions and derivatives. This activity could...
Curated OER
The Barbie Bungee Drop
What do math, bungee jumping, and Barbie® have in common? Young adventure seekers use rubber bands as bungee cords to predict a thrilling, but safe, jump for their doll. First, test jumps are conducted with a few rubber bands. Then more...
Curated OER
Barbie Bungee
Middle and high schoolers collect and analyze their data. In this statistics lesson, pupils analyze graphs for linear regression as they discuss the relationship of the function to the number of rubber bands and the distance of the...
Curated OER
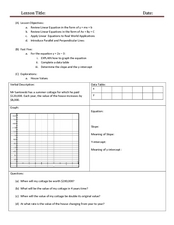
Review Linear Equations
Explore algebra I/algebra II with this series of worksheets. Pupils write linear equations in slope-intercept and standard form, graph linear equations, and apply linear equations to real world applications. The six-page learning...
Texas Instruments
Finding Linear Models Part III
Explore linear functions! In this Algebra I lesson, mathematicians graph data in a scatter plot and use a graphing calculator to find a linear regression and/or a median-median line. They use the model to make predictions.
Curated OER
Math: Real Time and Live
Get an interdisciplinary edge. Scholars study air contamination and slope. They record the time it takes for air fresheners to reach them at variable distances. They document their times, classify them by distance, and draw a scatter...
Curated OER
Linear Regression and Correlation
Learners explore scatter plots. For this linear regression lesson, groups of pupils graph scatter plots and then find the line of best fit. They identify outliers and explain the correlation. Each group summarizes and shares their...
Curated OER
Piecewise Linear Functions: Extending Stories to Graphs
Using this resource, scholars develop graphs that model situations by showing change over time. They answer 15 questions based on information from charts that show growth in weight. They extend the concepts to an assessment section of...


