National Security Agency
Are You Game? A Lesson Connecting Fractions and Probability
Exactly how fair are the board games children grow up playing? Young mathematicians investigate this questions as they work their way through this five-lesson series on basic probability.
Curated OER
Statistics with M&Ms
Seventh graders explore estimation, measurement, and probability. Students conduct surveys and create charts & graphs. They study the history of chocolate. Students design their own magazine advertisement or create a script for a...
Shodor Education Foundation
Playing with Probability
Review basic probability concepts with your class using different-colored marbles in a bag. Then pair up learners and have them play a cool online interactive game in which they race miniature cars using the roll of a die or two. The...
Curated OER
Rescue Mission Game
Students conduct probability experiments. In this rescue mission lesson plan, sudents play a game and collect statistical data. They organize and interpret the data and determine the probability of success. Students plot points on a...
Intel
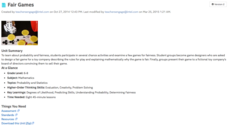
Fair Games
Who said things were fair? The unit introduces probability and its connection to fairness. The class interacts with activities of chance and plays games to relate them to fairness. Groups design a fair game and develop a presentation....
Curated OER
Probability and Sports
Students explore the concept of probability in sports. For this probability in sports lesson, students research a sport that they enjoy. Students find probability information related to their sport. Students share their findings with the...
Curated OER
Drive the Data Derby
Three days of race car design and driving through the classroom while guessing probability could be a third graders dream. Learn to record car speed, distances traveled, and statistics by using calculation ranges using the mean, median,...
Curated OER
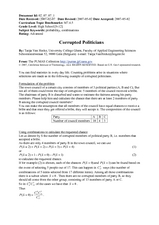
Corrupted Politicians
Students solve problems using statistics and probability. For this math lesson, students analyze how many corrupted members there are in a fictional town council. They give real life examples where statistics and probability can be used.
Bowland
Speed Cameras
Do speed cameras help reduce accidents? Scholars investigate this question using a series of spreadsheet activities. Along the way, they learn about randomness, probability, and statistical analysis.
Curated OER
Observing M&M Colors: A Multinomial Experiment
Students use hands-on activities to study statistics. They review the chi-square distribution and expected value. Activities involve discovering calculation a hypothesis, frequency distribution, and probability.
Curated OER
Mean Meadian and Mode
Students apply central tendencies to given data. In this statistics lesson, students calculate the mean, median, and mode as it relates to their data. They collect data and graph it while identifying the way the numbers are ordered.
Curated OER
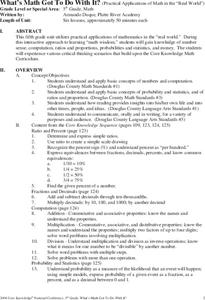
What's Math Got To Do With It?
Students explore numbers, computation, ratios, proportions, probabilities, statistics, and money in this six lessons unit. Practical applications in the real world are emphasized through an interactive approach to math in these lessons.
Curated OER
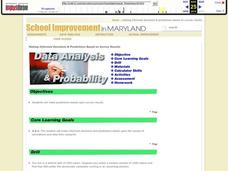
Data Analysis & Probability
Learners make predictions based on survey results. They calcuate sample proportions. Students estimate the number of voters in their district preferring the democratic candidate using their sample results. They review sample proportions...
Curated OER
Assessing and Investigating Population Data
Learners examine population projections. In this population data instructional activity, students research and collect data on the population of the United States. They explore and conclude future population growth patterns. Learners...
Curated OER
Tallest Stack Wins
Young scholars build a stack of pennies as tall as possible, recording the number of pennies they are able to stack before the tower falls. Then, sharing answers, they determine the average number of pennies that could be stacked.
Curated OER
The Survey Says
Students experience the development of statistical data. In groups, they construct a survey questionnaire for a target audience. Students produce the questionnaire, distribute it, collect it, and tabulate the data. Using EXCEL, the...
Curated OER
Statistics: Reading and interpreting production graphs
Students interpret and create different types of graphs. They analyze data from charts, develop a survey and design appropriate graphic illustrations and make a presentation.
Intel
Energy Innovations
Collaborative groups examine the importance of energy resources on quality of life by researching different energy sources and alternative energy sources through data analysis. They make a comparison of different countries and cultures,...
Curated OER
Genetics: Integrated with History and Art
Young scholars work cooperatively in pairing chromosomes, created statistical genetic babies using the face lab, constructed a color DNA booklet and demonstrated mitosis in a flip book.
Pennsylvania Department of Education
Equal Groups
Students explore statistics by completing a graphing activity. In this data analysis instructional activity, students define a list of mathematical vocabulary terms before unpacking a box of raisins. Students utilize the raisins to plot...
Curated OER
Teacher Preparation Notes on Genetics
Students explore genetics through various hands-on activities. In this biology lesson plan, students predict the probability of offspring genotypes and phenotypes using the Punnett Square. They explain the causes of genetic abnormalities.
Curated OER
The Car Pool is Coming
Students evaluate the number of people who travel out of their town to work. They figure out what the percentage of each town's commuting workers is to the number who commute in the region. They plot the percentages on a pie chart.
Curated OER
Pizza, Pizza
Students survey community members to determine their favorite pizza toppings and create a bar graph to show their findings. In this probability and statistics lesson, students collect data by conducting a survey. They analyze the data,...
Curated OER
Nineteenth Century Family Portraits
Students compare two nineteenth century family portraits using historical data, statistics, and historical context. Students analyze their own family pictures adjusting the criteria to the current decade. Lastly students study the...
Other popular searches
- Probability and Statistics
- Probability Statistics
- Probability" | "Statistics
- Probability & Statistics


