Illustrative Mathematics
Making a Ten (Grade 1)
How many ways can first graders make a 10? Using an addition chart, learners color in the 10s on the table. They notice and explain the meaning of the pattern, and how to get to another sum of 10.
Shodor Education Foundation
Transmographer
Introducing ... the Transmographer. Young mathematicians investigate translations, reflections, and rotations. The applet lets users perform transformations on triangles, squares, and parallelograms.
Shodor Education Foundation
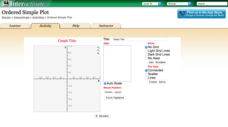
Ordered Simple Plot
Open your imagination to make algebra-inspired creations. An interactive lesson has scholars graph images from a set of parameters. Users can practice minimum values, maximum values, and scale as well as key features.
Shodor Education Foundation
Whole Number Cruncher
Time to crunch the numbers! Young scholars use an interactive number cruncher to practice operations with whole numbers. They input a number and watch as the number cruncher produces the output and then use the data pairs to determine a...
Shodor Education Foundation
Multi-Function Data Flyer
Explore different types of functions using an interactive lesson. Learners enter functions and view the accompanying graphs. They can choose to show key features or adjust the scale of the graph.
Shodor Education Foundation
Simple Maze Game
Avoid the mines and win the game! Young scholars direct a robot through a minefield by plotting points. Their goal is to reach the target in as few moves as possible.
Shodor Education Foundation
Linear Inequalities
An interactive lesson helps individuals learn to graph inequalities in two variables. Scholars can adjust the interactive to present the inequalities in standard or slope-intercept form.
Shodor Education Foundation
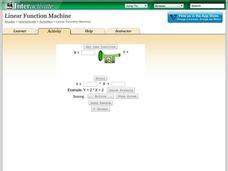
Linear Function Machine
What goes in must come out! Learners play with a function machine to determine the correct function. They enter input values and watch as the machine produces the output.
Nosapo
Getting to Know Each Other
How do you do? Guide learners through the basics of conversational English with an extensive set of discussion questions. Class members ask partners more about themselves, including their favorite hobbies, music, and time of day, as well...
National Association of School Nurses
Learn to Be Smart and Safe with Medicine
Begin educating young people on how to be smart and safe with medicine. Use a set of workbook pages to explore what symptoms are, uses for medications, how to read prescription and over-the-counter medicine labels, and who to trust when...
Emergency & Community Health Outreach
Breast Cancer: Prevent, Detect, Treat
Odds are, most of the members of your class know someone who has been affected by breast cancer. Teach them more about prevention through healthy lifestyles, detection with self-testing and mammograms, and the most effective treatments...
Nosapo
Verbs: Regular, Irregular, Simple Past Tense
Adding -ed to the ends of most verbs can change a sentence to the past tense—but what about verbs like think or draw? Provide class members with practice activities that focus on both regular and irregular verbs in the simple past tense.
CK-12 Foundation
Mean: Arithmetic Mean
How is a mean affected by changes in data? A well-designed animation allows individuals to manipulate data and watch the effect on the mean. Challenge questions help guide users to conclusions about outliers and skew within data.
CK-12 Foundation
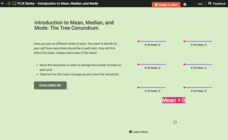
Introduction to Mean, Median, and Mode: The Tree Conundrum
How many trees should we plant? Using an interactive as a manipulative, individuals find the mean, median, and mode for sets of data. They determine the number of trees to plant in each plot of land to reach a statistical goal.
CK-12 Foundation
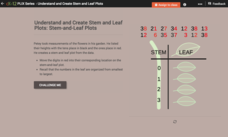
Understand and Create Stem-and-Leaf Plots: Stem-and-Leaf Plots
Explore the advantages to using a stem-and-leaf plot using an online lesson. Learners manipulate an animation to create a stem-and-leaf plot. They then calculate statistics for the data using their display. Guiding questions help them...
CK-12 Foundation
Understand and Create Stem-and-Leaf Plots: Event Survey
A good lesson doesn't just grow on trees! Help your classes understand the concept of a stem-and-leaf plot using an interactive lesson. Learners first create a stem-and-leaf plot from a set of data by dragging the values to the plot....
CK-12 Foundation
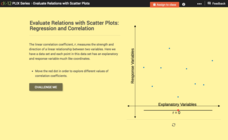
Evaluate Relations with Scatter Plots: Regression and Correlation
Introduce the concept of a correlation coefficient using an interactive lesson. Learners begin by manipulating a correlation coefficient and watching a graph change to represent the new value. Questions help strengthen their...
CK-12 Foundation
Multiple Line Graphs: Jack's Jumpshot
What are the advantages to seeing multiple data sets on the same graph? Scholars explore this question as they manipulate the animation within the lesson. Questions within the interactive ask individuals to make comparisons across the...
CK-12 Foundation
Line Graphs to Display Data Over Time: Strawberry Competition
Take the tediousness out of graphing. Using the interactive tool, learners can efficiently create a line graph from a set of data. They then use the graph to answer questions about specific trends in the data.
CK-12 Foundation
Line Plots from Frequency Tables: Sleep Cycles
Demonstrate the ease of using a frequency table. An interactive lesson allows learners to create a frequency table efficiently. Challenge questions ask your classes to analyze the data represented in the frequency table.
CK-12 Foundation
Broken-Line Graphs: Heating Curve of Water
Examine the unique graphs coined broken-line graphs. Using the phase change of water for data, learners answer questions related to the temperature and energy at different times in the cycle of the phase change. Questions focus on the...
CK-12 Foundation
Understand and Create Line Graphs: Line Graphs
Explore line graphs and their characteristics through an interactive lesson. Scholars follow a set of directions to plot data on a line graph. They then answer questions about the type of variables, minimum and maximum values, and...
PBS
Why Do We Have Seasons?
Explore the reason for the seasons! An interactive lesson allows learners to explore the earth's rotation from the viewpoint of four cities at different latitudes. It provides descriptive information at eight points during the orbit...
Nosapo
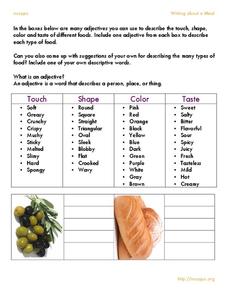
Writing about a Meal
You don't need to be a food critic to describe your meal accurately! A series of activities introduce learners to vivid adjectives when writing about the taste, smell, and feel of food. After working with word choice, parts of a...


