CK-12 Foundation
Logistic Functions: Fab Fitness
Strengthen your understanding of logistic functions. Young mathematicians change the carrying capacity of a logistic function and see how function values change. The function models the number of members in a gym over time.
CK-12 Foundation
Restricted Domain and Range: Restricted Circle Radius and Area
There's no restriction to how much your class can learn about domain and range. Users of an interactive adjust the radius of a circle to see its effects on the area. They note how restrictions in the domain (radius) relate to...
CK-12 Foundation
Least-Squares Regression
Residual plots let you find the perfect line of best fit. As users adjust the points on a scatter plot and a possible line of best fit, the interactive automatically changes the residual plot. This change allows them to see connections...
CK-12 Foundation
Properties of a Normal Distribution: Uniform Distributions
There's nothing normal about an extraordinary resource. Scholars change the dimensions of a normal distribution using a slider interactive. Determining the area under the graph gives probabilities for different situations.
CK-12 Foundation
Coefficient of Variation: Diverse Populations
What is the height of school clubs? Learners use sliders to calculate the coefficient of variation for three different school groups. Using the calculations, class members compare the variation in the heights of the groups.
GeoGebra
Conjectures and Proof
Transform proofs using triangle rotations. By rotating a triangle around various points, class members develop proofs. Participants prove relationships of alternative interior angles formed by parallel lines and the sum of the interior...
GeoGebra
More Ferris Wheels
Take a ride on a Ferris wheel. Using sliders to adjust the parameters of a Ferris wheel, pupils investigate the height of a point over time. The interactive traces out the curve on a time-height graph. Learners use what they learned to...
GeoGebra
Leaping Lizards
Transform lizards onto different locations. The interactive provides a diagram of a lizard and several locations. Pupils use their knowledge of transformations to move the lizard to the different locations and use the tools of GeoGebra...
CK-12 Foundation
Stratified Random Sampling: An Extracurricular Study
Learning isn't a random process. A well-designed interactive lesson helps classes make key conclusions about stratified random sampling. They calculate group percentages and use those percentages to decide on sampling totals.
CK-12 Foundation
Create and Understand Box-and-Whisker Plots: Babies in a Waiting Room
Explore the strengths and weaknesses of box-and-whisker data display. An interactive lesson asks learners to create a box-and-whisker plot from a set of data. Challenge questions focus on determining what types of conclusions they can...
CK-12 Foundation
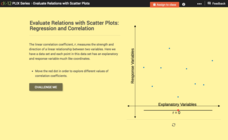
Evaluate Relations with Scatter Plots: Regression and Correlation
Introduce the concept of a correlation coefficient using an interactive lesson. Learners begin by manipulating a correlation coefficient and watching a graph change to represent the new value. Questions help strengthen their...
PBS
Why Do We Have Seasons?
Explore the reason for the seasons! An interactive lesson allows learners to explore the earth's rotation from the viewpoint of four cities at different latitudes. It provides descriptive information at eight points during the orbit...
CK-12 Foundation
Frequency Polygons: Constructing a Frequency Polygon
Connect the dots on frequency. Given a distribution table of scores on an assessment, learners create a frequency polygon by moving points on a graph to the correct frequency. The pupils use the display to answer questions about the...
CK-12 Foundation
Single Bar Graphs: Cupcakes
What is a little cake among friends? Given the relationship between the number of cupcakes five friends have, pupils create a bar graph. The learners answer questions about the graph and adjust the graph if one friend shares some of his...
CK-12 Foundation
Single Bar Graphs: Hockey Teams
Raise the bar for hockey fans. Using data about favorite hockey teams, pupils build a bar graph. They use the information from the graph to make comparisons and solve one- and two-step problems.
CK-12 Foundation
Interpretation of Circle Graphs: Northwest Region Population Pie
Given populations of the five Northwestern states, learners create a circle graph. Using the data and the pie chart, they make comparisons between the populations of the states. Finally, the pupils determine how the chart will change...
CK-12 Foundation
Types of Data Representation: Baby Due Date Histogram
Histograms are likely to give birth to a variety of conclusions. Given the likelihood a woman is to give birth after a certain number of weeks, pupils create a histogram. The scholars use the histogram to analyze the data and answer...
CK-12 Foundation
Displaying Univariate Data: Ordering Leaves
Leaf a little time to organize data. Given data displayed in a stem-and-leaf plot, learners organize the data in a list. Pupils use the data to determine the mode, median, and range of the data set. They determine the benefits of using a...
CK-12 Foundation
Data Summary and Presentation: Chart for Grouping Data
Get social! Create a display of social media use for a class. Pupils use provided information about the time spent on social media to construct a histogram. Using the histogram, learners interpret the data to answer questions.
CK-12 Foundation
Graphs for Discrete and for Continuous Data: Discrete vs. Continuous Data
Not all data is the same. Using the interactive, pupils compare data represented in two different ways. The learners develop an understanding of the difference between discrete and continuous data and the different ways to represent each...
CK-12 Foundation
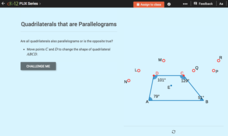
Parallelogram Proofs: Quadrilaterals that are Parallelograms
What conditions must be met for a quadrilateral to be a parallelogram? A slider interactive allows individuals to move the vertices of a quadrilateral. They answer questions that prove whether a given quadrilateral is a parallelogram.
CK-12 Foundation
Identify Line Types: Identify Types of Lines
If lines aren't parallel or perpendicular, then what are they? An interactive lets users rotate a line to change its orientation
with respect to another line. It then indicates whether the
lines are parallel, perpendicular, or...
CK-12 Foundation
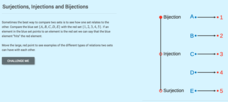
The Real Numbers: Surjections, Injections and Bijections
Inject a great interactive into your lesson plans. Scholars learn about injections, surjections, and bijections of sets. They use an interactive that shows an example for each of these relationships between sets.
CK-12 Foundation
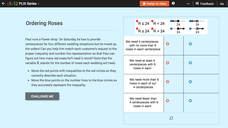
Checking Solutions to Inequalities: Ordering Roses
It's important to have the correct number of flower arrangements at a wedding. Scholars match an inequality and a graph given a situation involving roses for wedding receptions. A set of challenge questions checks the matching pairs.


