Wordpress
Equation Table Graph
Your Algebra learners will appreciate this fabulous, two-page printable. The first page has a list of numbers that lead to the learners writing an equation in a cloud that represents these numbers, and then filling in a table, and...
Mathed Up!
Two Way Tables
When presented with categorical data, a two-way frequency table is a great way to summarize the information. Pupils organize categorical data using a two-way table, then use the tables to determine missing data and to calculate simple...
CPM
Tables, Equations, and Graphs
Eighth and ninth graders solve and graph 24 different problems that include completing input/output tables and graphing the pairs. First, they find the missing values for each table and write the rule for x. Then, students write the...
CPM
How to Recognize the Type of Graph from a Table
Linear, quadratic, and exponential functions are represented only by their table of values in this simple, well-written worksheet. Learners decide the type of graph represented based on the differences in the function values. Included is...
CK-12 Foundation
Frequency Tables to Organize and Display Data: Favorite Films
What information can your class determine if they know the number of people attending movie showings? Using the information about the number of people at each screening, learners develop a frequency table. The pupils analyze the type of...
EngageNY
Summarizing Bivariate Categorical Data in a Two-Way Table
Be sure to look both ways when making a two-way table. In the lesson, scholars learn to create two-way tables to display bivariate data. They calculate relative frequencies to answer questions of interest in the 14th part of the series.
CK-12 Foundation
Function Rules for Input-Output Tables: Soda Sugar Function Table
Examine the relationship between the input and output variables in a table of values. As learners build an input-output table using online manipulatives, they begin to identify patterns. They answer questions about these patterns and...
Charleston School District
Two-Way Tables
Do males or females buy more iPhones? Using a two-way frequency table can help to answer this question. Pupils learn to create two-way frequency tables and then how to analyze the data within the tables. Learners find frequencies,...
5280 Math
Multiplication Table Algebra
Patterns, patterns, everywhere! Young scholars examine the multiplication table to identify patterns. Their exploration leads to an understanding of the difference of squares and sum of cubes by the completion of the algebra project.
Corbett Maths
Median for a Frequency Table
Try to find the middle of a frequency table. Using a frequency table of ages, the video shows how to use a formula to determine the position of the median. The resource uses frequency tables with both even and odd numbers of data points.
Utah Education Network (UEN)
Linear Relationships: Tables, Equations, and Graphs
Pupils explore the concept of linear relationships. They discuss real-world examples of independent and dependent relationships. In addition, they use tables, graphs, and equations to represent linear relationships. They also use ordered...
Math Worksheets Land
Patterns of Association (Using Data Table) - Matching Worksheet
This resource is the last of a four-part series that practices calculating percents based on data represetned in tables. This page has four multiple choice problems that analyze the data tables to answer a question.
Charleston School District
Tables of Linear Functions
Don't forget the tables! The previous lessons in this five-part series examined the linear equation and graph relationship. The current lesson adds tables to the mix. At completion, individuals should be able to create a table of values,...
Math Worksheets Land
Patterns of Association (Using Data Tables) - Guided Lesson
The worksheet belongs to a four-part resource that applies percentages to data tables. The page has three practice problems that continues with the development of this topic.
CK-12 Foundation
Line Plots from Frequency Tables: Sleep Cycles
Demonstrate the ease of using a frequency table. An interactive lesson allows learners to create a frequency table efficiently. Challenge questions ask your classes to analyze the data represented in the frequency table.
CK-12 Foundation
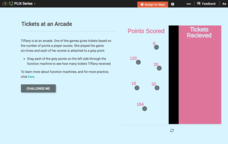
Function Rules for Input-Output Tables: Tickets at an Arcade
This is the ticket to learning about function rules! Using online manipulatives, scholars build a table of values and then answer questions about the related function. They examine the relationship between the input and output values and...
CK-12 Foundation
Input-Output Tables for Function Rules
How does changing a graph affect the function? Learners watch the changing input-output table as they adjust the location of the line graph. Questions prompt them to complete a table of values and determine the function rule.
Curated OER
Frequency Tables and Stem-and-Leaf Plots
Students are introduced to the function of frequency tables and stem and leaf plots. In groups, they determine the frequency of their teacher coughing, ringing a bell or raising their hand. To end the activity, they determine frequency...
Math Worksheets Land
Patterns of Association (Using Data Tables) - Independent Practice Worksheet
Here is a instructional activity that belongs in a four-part resource that has learners practice using data tables to calculate percentages. The page has ten problems with different data tables asking to find different percents.
Math Worksheets Land
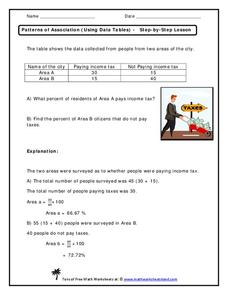
Patterns of Association (Using Data Tables) - Step-by-Step Lesson
This worksheet belongs to a four-part resource that gathers information from data tables to calculate percentages. The page introduces one problem and shares an explanation to the answer.
Illustrative Mathematics
Walk-a-thon 1
Your mathematician's job is to explore the relationship between hours and miles walked during a walk-a-thon. The activity compels your learners to experiment with different means in finding out this proportional relationship. The answer...
Illustrative Mathematics
Walk-a-thon 2
During a walk-a-thon your learners must determine the walking rate of Julianna's progress. Using tables, graphs, and an equation, they must be able to calculate the time it took her to walk one mile and predict her distance based on the...
Saxon
Plotting Functions
Youngsters use a graphing calculator to assist in creating a function table. They graph the function on a coordinate plane. They explore the relationship between the domain and range in the graph. This four-page worksheet contains two...
Curated OER
Dot Plots
Number crunching statisticians explore displaying data with dot plots and define the difference between quantitative data and qualitative data. Dot plots are created based on a set of given data and analyzed.
Other popular searches
- Multiplication Tables
- Math Tables and Tools
- Function Tables
- Input/output Tables
- Multiplication Tables 1 100
- Frequency Tables
- Input Output Tables
- +Math Tables Tips Tools
- Data Tables
- Tables, Charts and Graphs
- Multiplication Tables Songs
- Frequency Tables Line Plots


