Curated OER
Lengths of Horizontal and Vertical Line Segments
Use this lengths of horizontal and vertical line segments practice worksheet to have learners sharpen their problem solving skills as they solve six story problems.
K-5 Math Teaching Resources
Blank Bar Graph Template
This template is just begging for your young mathematicians to fill it in with colorful bar graphs! With horizontal and vertical axes in place and grid lines for added support, this is a great resource for teaching children how to...
Curated OER
Understanding Latitude and Longitude
Teaching learners about latitude and longitude can get a little complicated. Present the concept by first representing it as a graph. Just like finding a location on a graph using the x and y-axis, learners will be able to locate items...
Curated OER
Graphing Data
Seventh graders solve and graph 10 different problems that include various questions related to data on a graph. First, they create bar graphs to display the data given. Then, pupils determine the random sample of a population listing...
Primary Resources
Coordinate Pairs: An Introduction
Ordered pairs, the x and y-axis - sounds like it's time to introduce learners to the plotting points on a graph! This presentation is great as it introduces the concept, provides an example of how to use a coordinate plane, and then...
EngageNY
Drawing the Coordinate Plane and Points on the Plane
To plot a point in the coordinate plane, you first need a coordinate plane. Pupils learn to draw an appropriate set of axes with labels on a coordinate plane. They must also determine a reasonable scale to plot given coordinate pairs on...
Concord Consortium
Shooting Arrows through a Hoop
The slope makes a difference. Given an equation of a circle and point, scholars determine the relationship of the slope of a line through the point and the number of intersections with the circle. After graphing the relationship, pupils...
Curated OER
Making a Line Graph
In this line graph activity, students use data given in a table and assign axes, make a scale, plot data and make a line or curve on their constructed graphs.
Curated OER
Reflection: Student Worksheet
In this math worksheet, students will work independently to trace a stencil on an x-axis. Then students will follow a procedure to trace the image on the horizontal line of reflection. Students will observe that reflections and rotations...
Curated OER
Graphing Ordered Pairs
Are you working on graphing ordered pairs in your class? In this worksheet, learners, after looking over and studying how to graph ordered pairs, plot points on a coordinate grid and connect the dots. Class members also identify what...
Utah Education Network (UEN)
Mathematics: Growing Patterns
Learners graph growing patterns using ordered pairs on a coordinate grid. They read The Fly on the Ceiling, a Math Myth.
Curated OER
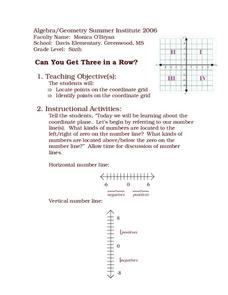
Three In a Row
Sixth graders examine how to locate coordinate points. In this coordinate graphing instructional activity, 6th graders locate the x and y axis. Students use their arms to show horizontal and vertical lines, participate in group and...
Curated OER
Graphing Coordinates
Sixth graders practice graphing coordinates. In this geometry activity, they use the x and y axis to locate points that must be connected in the right sequence to form a straight line.
Curated OER
Grids and Coordinates
In this grids worksheet, learners learn about grids, or coordinate plants, axes, coordinates, plotting and ordered pairs. They then complete the 5 questions using what they learned. The answers are on the last page.
Curated OER
Play Battleship on Graph Paper
Who says learning can't be enjoyable? Your class will love identifying the x axis and y axis of a coordinate plane and plotting various points when it's dressed up in the guise of a Battleship game. Rather than sets of the actual game,...
Curated OER
Using the Distance Formula
In this distance formula worksheet, students solve and complete 30 various types of problems. First, they find the exact distance between each pair of points and make a sketch of the situation. Then, students find the center, horizontal...
Curated OER
Slope Exploration
In this slope exploration worksheet, 9th graders solve and complete 18 different problems that include graphing and investigating the slope of various equations. First, they graph each pair of points and draw a line that contains both...
Curated OER
Usage and Interpretation of Graphs
Students explore graphing. In this graphing instructional activity, students predict how many shoe eyelets are present in the classroom. Students count eyelets and work in groups to organize and chart the data collected. Students put all...
Flipped Math
Reflections
Take some time to reflect on graphing. Learners count a point's distance from the line of reflection to create reflections of geometric figures. Given the rules for four basic lines of reflections, pupils determine the points to create...
Curated OER
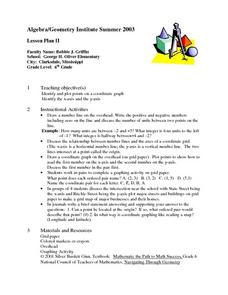
Coordinate Planes
Identifying the location of ordered pairs on coordinate planes is the focus in the math lesson presented here. In it, 4th graders are introduced to coordinate pairs, the x/y axis, and the techniques associated with this type of graphing....
Curated OER
Human Population Growth
In this human population growth worksheet, students create a graph of human population growth and predict future growth using the data given in a chart. Students identify factors that affect population growth.
Curated OER
Magnetic Storms
In this magnetic storms worksheet, students use a graph of data collected over time showing the magnitude of a magnetic storm. Students use the data to solve 6 problems about the graph and they determine the strength of the storm at...
Curated OER
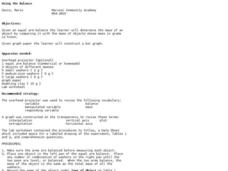
Using the Balance
Learners determine the mass of various objects. In this integrated math and science lesson, students use an arm balance to compare a known object to a combination of washers with a fixed weight. Learners record data, construct a bar...
Curated OER
Learn How to Graph
Students examine various types of charts and discover how to construct a line graph. Using graph paper, they construct a graph displaying weight loss over a five-year period. They draw copnclusions from the completed graphs.


