College Board
2011 AP® Statistics Free-Response Questions Form B
Is the sequel better than the original? The 2011 AP® Statistics free-response questions, Form B, is available for instructors to reference. Among the topics covered in the exam are histograms, distributions, studies and experiments,...
College Board
2011 AP® Statistics Free-Response Questions
Familiarize yourself with the AP® exam by looking at past tests. A PDF file provides the 2011 AP® Statistics free-response questions. The questions include topics such as mean, standard deviation, conditional probability, sampling...
College Board
Is That an Assumption or a Condition?
Don't assume your pupils understand assumptions. A teacher resource provides valuable information on inferences, assumptions, and conditions, and how scholars tend to overlook these aspects. It focuses on regression analysis, statistical...
College Board
2014 AP® Statistics Free-Response Questions
Turn a summative assessment into a formative assessment! The 2014 AP® Statistics exam shows learners the level of difficulty they will encounter on their end-of-course exams. Within the six items, the test highlights concepts such as...
College Board
2015 AP® Statistics Free-Response Questions
Statistics is all about making inferences. Can you infer how your pupils will fair on their AP® exams? Collect your own data by giving them practice tests such as the 2015 free-response exam. The six-question test includes topics such as...
College Board
2016 AP® Statistics Free-Response Questions
Test your classes on their knowledge of advanced statistic concepts. Young math scholars get a sneak peek at the end of course AP® statistics exam with the released items from the 2016 test. The six-question free response exam addresses...
College Board
2018 AP® Statistics Free-Response Questions
Are your classes ready for their final exams? Give them a test run with the 2018 AP® exam. The resource provides the six free-response questions covering topics such as confidence intervals, population proportions, and least-squares...
CCSS Math Activities
Social Security Trust Fund
Will Social Security still be around when you retire? Given data on the predicted balance of the social security fund over time, scholars plot the points on a coordinate grid and determine if a quadratic regression fits the data. They...
Kenan Fellows
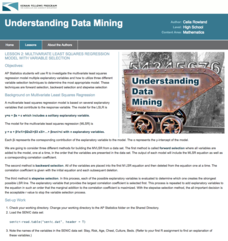
Multivariate Least Squares Regression Model with Variable Selection
The risk of contracting an infection in the hospital is low, but it does happen. Learn what risk factors have the highest correlation with hospital-acquired infections in the final lesson of a three-part series. Using the open source R...
Kenan Fellows
How Does an Unhealthy Diet Influence our Health and Well-Being?
You are what you eat, or so they say! After surveying family and friends on a week of eating habits, learners analyze the data for patterns. They compare different variables such as fats and cost, fats and calories, or fats and LDLs.
Kenan Fellows
Designing and Analyzing Data Collected from Wearable Devices to Solve Problems in Health Care
Wearable devices have become more the norm than the exception. Learners analyze data from a sample device with a regression analysis in a helpful hands-on lesson. Their focus is to determine if there is a connection between temperature...
101 Questions
Small Trebuchet
Travel back to medieval time where learning is just a stone's throw away! A video introduction shows a trebuchet (catapult-like machine) as it launches a rock into a lake. Learners use their quadratic modeling skills to predict the...
101 Questions
Angry Bird Quadratics
Launch your classes into a modeling lesson. Young scholars watch angry bird trajectories and make predictions based on their knowledge of quadratic functions. The lesson includes a series of questioning strategies to lead learners to the...
Beyond Benign
Water Bottle Unit
How much plastic do manufacturers use to create water bottles each year? The class explores the number of water bottles used throughout the years to determine how many consumers will use in the future. Class members compare different...
Beyond Benign
Municipal Waste Generation
Statistically, waste may become a problem in the future if people do not take action. Using their knowledge of statistics and data representation, pupils take a look at the idea of waste generation. The four-part unit has class members...
CK-12 Foundation
Least-Squares Regression
Residual plots let you find the perfect line of best fit. As users adjust the points on a scatter plot and a possible line of best fit, the interactive automatically changes the residual plot. This change allows them to see connections...
CK-12 Foundation
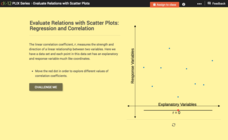
Evaluate Relations with Scatter Plots: Regression and Correlation
Introduce the concept of a correlation coefficient using an interactive lesson. Learners begin by manipulating a correlation coefficient and watching a graph change to represent the new value. Questions help strengthen their...
PBL Pathways
Cell Phones
Calling all subscribers! Model revenue based on individual cell phone subscribers. The project-based learning activity presents a challenge to scholars from a cell phone company. Individuals model data provided to them from the company...
PBL Pathways
Students and Teachers 2
Examine trends in student-to-teacher ratios over time. Building from the first task in the two-part series, classes now explore the pattern of student-to-teacher ratios using a non-linear function. After trying to connect the pattern to...
Intel
Track the Trends
Allow your classes to research what interests them. An engaging STEM lesson, the fourth in the series of six, asks individuals to choose a topic of interest and analyze the data through regression models. The regression equations allow...
Virginia Department of Education
Logarithmic Modeling
Explore logarithms and logarithmic regression. Young mathematicians first learn about inverse functions and about the logarithm function family. They take their newfound knowledge to use logarithmic functions to model situations and...
Balanced Assessment
Monitor Pricing
Out with the old and in with the new. Learners use a set of prices of computer monitors from 1994 to make a prediction. They then use one current price and what they know about the old prices to make a more recent prediction. Their...
EngageNY
Bean Counting
Why do I have to do bean counting if I'm not going to become an accountant? The 24th installment of a 35-part module has the class conducting experiments using beans to collect data. Learners use exponential functions to model this...
Statistics Education Web
The United States of Obesity
Mississippi has both the highest obesity and poverty rate in the US. Does the rest of the data show a correlation between the poverty and obesity rate in a state? Learners tackle this question as they practice their skills of regression....


