Curated OER
Graphs
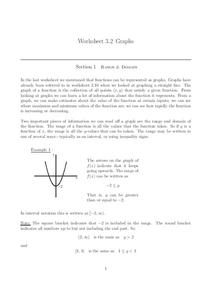
In this graphs worksheet, learners solve and complete 15 various types of problems. First, they determine the range of the function of the graph shown and write in interval notation. Then, students find the domain of the function in the...
Flipped Math
Calculus AB/BC Unit 5 Review: Analytical Applications of Differentiation
Time to put it all together in one sheet—well five. Pupils review all the topics presented in the resources for Analytical Applications of Differentiation. The five pages summarize the concepts with explanations and examples.
Flipped Math
Calculus AB/BC Mid-Unit 5 Review: Analytical Applications of Differentiation
It's time to put analytical applications to work. Learners use the eight questions of the mid-Unit 5 review to refresh their memories of the key points. Pupils apply what they have learned to use the Mean Value Theorem, find extrema...
Flipped Math
Calculus AB/BC - Using the Candidates Test to Determine Absolute (Global) Extrema
Absolutely! Find the global maximum and minimums. Pupils watch a video showing how to find the absolute maximums and minimums of a function on an interval by testing critical points. The learners see how to determine whether a critical...
Flipped Math
Calculus AB/BC - Intermediate Value Theorem (IVT)
Acquire expert-level knowledge in the Intermediate Value Theorem. Viewers of an informative video learn about the Intermediate Value Theorem. After learning the definition, they consider several examples where they must apply the theorem...
Flipped Math
Calculus AB/BC - Confirming Continuity Over an Interval
Confirm one's expertise with confirming continuity over an interval. Pupils first review how to determine the domain of a function taking denominators, roots, and logarithms into account. They then connect this concept to continuity in...
Radford University
Skate Ramp
Going up and down makes a more exciting ride. Pupils recall what they know about continuity and limits of functions. Working in groups, classmates design a skateboard ramp that meets a given set of criteria, using at least three...
California Department of Education
Consonance and Dissonance: Creating Intervals for Emotions (CTE)
How are music and emotion related? Using lesson plan two of four from the Changing One's Tune: A Music Therapy STEM Integrated Project Series, scholars explore the connection between the two topics. They learn to recognize different...
College Board
AP® Psychology: Teaching Statistics and Research Methodology
Psychologists use statistics? Scholars investigate the research behind the methodology of statistical analysis. Using hands-on practice, case-studies, and scatterplots, they complete various tasks to understand the very roots of high...
Concord Consortium
Looking through a Window
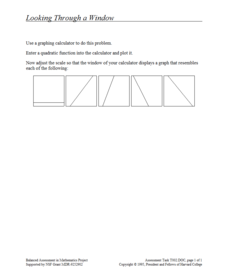
Here's a window into graphing calculators. Scholars use a graphing calculator to plot a quadratic function. They then adjust the window to make the graph look like that of a linear function and must recreate given graphs.
Concord Consortium
Boards II
Build spreadsheet skills while investigating decimal multiplication. An open-ended task asks learners to edit a spreadsheet to create a multiplication table for decimals. Provided with a specific interval, pupils create formulas that...
Concord Consortium
Boards I
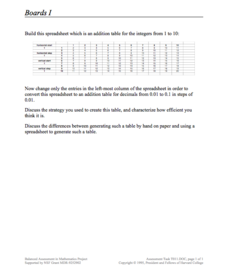
Learners create patterns in a table to mimic the function of an electronic spreadsheet. The result is a table that creates an addition table for decimals in intervals of one-tenth. While creating the pattern, pupils must thoroughly...
CK-12 Foundation
Absolute Versus Local Extrema
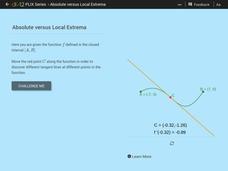
Get the class to take an extreme look at functions. The interactive presents a function on a closed interval with a movable tangent line. Using the given function, pupils determine the extrema, critical points, and points of inflection.
CK-12 Foundation
Intermediate Value Theorem, Existence of Solutions: Function Exploration
Does the value exist? The interactive allows pupils to visualize the Intermediate Value Theorem. Using the visualization, individuals respond to questions using specific values and general values. The class comes to the conclusion what...
CK-12 Foundation
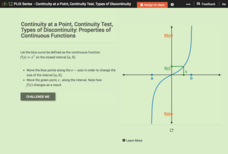
Continuity at a Point, Continuity Test, Types of Discontinuity: Properties of Continuous Functions
Take a closer look at continuous functions within given intervals. Using the parent cubic function, learners explore properties of continuous functions on intervals. Pupils interpret the Intermediate Value Theorem and the Extreme Value...
CK-12 Foundation
Frequency Polygons: Constructing a Frequency Polygon
Connect the dots on frequency. Given a distribution table of scores on an assessment, learners create a frequency polygon by moving points on a graph to the correct frequency. The pupils use the display to answer questions about the...
EngageNY
Creating a Histogram
Display data over a larger interval. The fourth segment in a 22-part unit introduces histograms and plotting data within intervals to the class. Pupils create frequency tables with predefined intervals to build histograms. They describe...
Mathed Up!
Frequency Polygons
Frequency polygons are a different way to represent frequencies over intervals. Pupils take frequencies for intervals of data from a frequency table and plot them as a frequency polygon. Budding mathematicians find information about the...
Statistics Education Web
It Creeps. It Crawls. Watch Out For The Blob!
How do you find the area of an irregular shape? Class members calculate the area of an irregular shape by finding the area of a random sampling of the shape. Individuals then utilize a confidence interval to improve accuracy and use a...
Statistics Education Web
Walk the Line
How confident are you? Explore the meaning of a confidence interval using class collected data. Learners analyze data and follow the steps to determine a 95 percent confidence interval. They then interpret the meaning of the confidence...
Statistics Education Web
What Percent of the Continental US is Within One Mile of a Road?
There are places in the US where a road cannot be found for miles! The instructional activity asks learners to use random longitude and latitude coordinates within the US to collect data. They then determine the sample proportion and...
Statistics Education Web
Did I Trap the Median?
One of the key questions in statistics is whether the results are good enough. Use an activity to help pupils understand the importance of sample size and the effect it has on variability. Groups collect their own sample data and compare...
West Contra Costa Unified School District
Using Derivatives to Graph Polynomials
You can learn to graph as well as a calculator using calculus. The lesson introduces using derivatives to find critical points needed to graph polynomials. Pupils learn to find local maximums and minimums and intervals of increase and...
West Contra Costa Unified School District
The Extreme Value Theorem
Finding the critical numbers of a function can be extreme. The lesson introduces the Extreme Value Theorem to the class with a graph. Pupils then have an opportunity to practice determining the values using an algebraic function.


