Curated OER
Graphing Standard Form Inequality
Students solve equations and graph it. For this algebra lesson, students solve inequalities and rewrite them in the slope intercept form. They graph the boundary lines first either as dashed or solid and shade the correct side of the line.
Raytheon
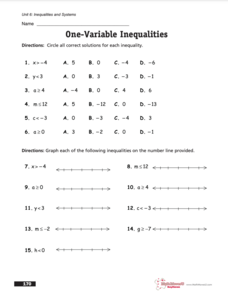
Inequalities and Systems
For this one variable inequalities worksheet, middle schoolers circle the correct solutions, complete graphing problems, and solve for the variables. Students complete 37 problems.
Curated OER
Linear Inequalities
High schoolers solve linear inequalities. In this solving linear inequalities lesson, students solve one step inequalities algebraically. High schoolers graph the solutions on a number line. Students compare the graphs of various...
Curated OER
Graphing Linear, Circular, and Parabolic Inequalities
In this graphing activity, students are given nine inequalities and then must graph five of their intersections. A grid and cartoon hint are provided.
Curated OER
Graphing systems of inequalities
In this graphing worksheet, students graph ten systems of inequalities. Kids are then asked to find the area of the regions. A challenge problem is included. where students are asked to find the volume of the resulting solid.
Curated OER
Graphing Inequalities
Students graph linear equations and then find the person in class whose linear equation graph is perpendicular to theirs. For this graphing inequalities lesson plan, students graph their perpendicular slopes and then once their find...
Curated OER
Graph Related Linear Inequalities
Students explore the concept of linear inequalities. In this linear inequality lesson, students graph linear inequalities using Microsoft Excel.
Curated OER
ACT Questions of the Day 5/21/08
In this ACT practice worksheet, students solve the ACT question of the day in which they select the graph that represents the inequality equation. There are 5 graphs to choose from.
Curated OER
Why Did the Plum Divorce the Grape? What Did the Boy Tree Say to the Girl Tree?
In this solving inequalities instructional activity, students graph and shade 15 inequalities. Students then use their shading to help answer the two riddles.
Curated OER
Linear Inequalities
In this linear inequalities learning exercise, students graph and shade 6 linear inequalities. Students then graph and shade 3 absolute value inequalities.
Curated OER
Graphing Inequalities in Two Variables
In this graphing inequalities worksheet, students shade 3 inequality problems. Students then graph and shade 4 additional inequalities.
Curated OER
Graphing Inequalities
In this graphing inequalities worksheet, students complete 8 inequality tables. Students then graph and shade the 8 inequalities on a coordinate plane.
Curated OER
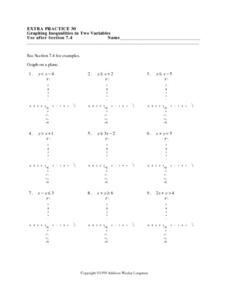
Graphing Inequalities in Two Variables: Extra Practice 30
In this math worksheet, students graph inequalities on a coordinate grid. The eight problems have a coefficient of one for the y variable. Three problems have a negative value for y. The final four problems are horizontal or vertical lines.
Curated OER
Graphing Linear Inequalities
In this graphing linear inequalities worksheet, students graph 1 linear inequality. Students walk through each step to graphing the inequality and shading the appropriate region on the graph.


