Curated OER
Using Extrapolations
In this using extrapolations learning exercise, 6th graders use data analysis to answer nine questions about data prediction and extrapolation.
Curated OER
Mean, Mode and Bar Graphs
In this mean, mode and bar graphs worksheet, 5th graders analyze the data given, then answer three questions about a bar graph and the data shown.
Curated OER
Active Wear
Students interpret and analyze data. In this middle school mathematics lesson, students conduct an experiment in which they investigate which solar collector, black, white, or silver, absorbs the most heat. Students examine the graphs...
Curated OER
Obstacles to Success: Misleading Data
Eleventh graders explore how data reported by country agencies can mislead the public intentionally or unintentionally. In this Cross Curricular activity, 11th graders analyze charts and graphs in order to draw conclusions. Students...
Curated OER
School Bus Minutes
In this interpreting data instructional activity, students examine table regarding time spent on the school bus. Students respond to 5 short answer questions that require them to read the data and use their problem solving skills.
Curated OER
Bouncy Ball Collections
In this data table instructional activity, students examine a table regarding bouncy ball data and respond to 4 questions regarding the data.
Curated OER
Reading Graphs
In this reading graphs practice worksheet, students examine a graph and respond to 5 questions that require them to record the coordinates of 5 shapes on the gridded graph.
Curated OER
Analyze a Survey
In this analyzing data worksheet, students read a tally chart regarding survey information and respond to 4 analytical questions regarding the data.
Curated OER
Penny Drive
In this analyzing data instructional activity, learners examine information regarding a penny drive and respond to 6 short answer questions pertaining to the data.
Curated OER
Population Dilemma
Ninth graders explore population growth. In this Algebra I activity, 9th graders conduct an experiment simulating population growth. Students create a model and relate the results to a real-world situation. Students create a scatter...
Curated OER
Completing frequency diagrams from displayed data
In this frequency activity, students use data in graphs and charts to complete a frequency diagram. Students fill in 26 spaces in the diagram.
Curated OER
The Numbers Behind Hunger: Rate of Change
Explore the concept of world hunger by having students collect and graph 1990 world hunger statistics. They will analyze the data in order to determine how to decrease world hunger rates and try to determine problems and solutions of...
Curated OER
Sorting and Graphing Animals
Students inquire about animals using SIRS Discoverer or eLibrary Elementary. For this organizing data lesson, students sort pictures of animals in various ways and develop graphs. Students locate a mammal, reptile, fish, insect or bird...
Curated OER
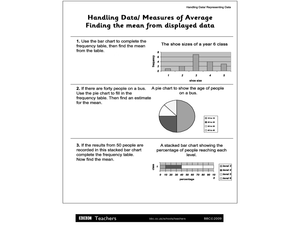
Handling Data/Measures of Average - Finding the Mean from Displayed Data
For this mean and average worksheet, students use the bars and charts to help them find the means using the given data. Students solve 3 problems.
Curated OER
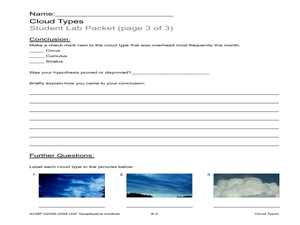
Cloud Types
Students examine cloud types. In this cloud activity, students identify cloud types, observe clouds and collect data, and analyze data to identify the most common cloud they observe overhead during the course of a month.
Curated OER
Saltwater Science
Students conduct an experiment that shows them how salt water allows things to float. In this salt water lesson plan, students mix ingredients together to create salt water and observe how it makes the oceans dense. They then interpret...
Curated OER
Permafrost
Students use a thermometer to analyze soil temperature data to determine which soil sample is normal, and which one is permafrost. In this permafrost lesson plan, students participate in a hands on activity where they identify the active...
Curated OER
Mathematical Reasoning
In this data analysis worksheet, students read a list of 4 criteria and then select the picture on the sheet that matches the criteria.
Curated OER
Data Handling Techniques
Students study data analysis methods. In this data analysis lesson, students study data compression and data editing methods used for the spacecraft Galileo. Students study the 'lossless' and 'lossy' techniques.
Curated OER
My Peanut Butter is Better Than Yours!
Young scholars explore the concept of statistical data. In this statistical data lesson, students read an article about the dangers of peanut butter to those who are allergic. Young scholars perform a taste test of two different brands...
Curated OER
Exploring the USA and the World with Cartograms
Young scholars investigate cartograms in order to explore the different countries on Earth. In this world geography lesson, students use the Internet to analyze data on different cartograms. Young scholars compare data, such as...
Curated OER
What's Your Favorite Season?
Students collect data on the favorite seasons. In this data collection and analysis instructional activity, students learn about displaying data on charts and graphs. They collect data about the favorite seasons of the children in their...
Curated OER
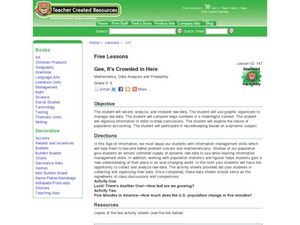
Gee, It's Crowded in Here
Students interpret raw data about population statistics. In this raw data lesson plan, students plug the data into graphic organizers and draw conclusions based on their findings.
Curated OER
Organizing Data
Third graders investigate ways to organize data. In this tally marking lesson plan, 3rd graders practice drawing tally marks to represent an item of data. Students also make connections with skip counting by fives.


