Illustrative Mathematics
Election Poll, Variation 1
Your class will learn what it means to take a random sample of a population and to draw inferences from the information gained. In part a, of the exercise, you discuss with your class how students during a class election can be best...
Illustrative Mathematics
Mr. Brigg's Class Likes Math
A quick discussion question that brings some collaboration into your classroom will allow your thinkers to make a decision about sampling. Mr. Briggs wants to know if the results from his class are a valuable comparison to the entire...
Yummy Math
Starbucks Drinks
The casual language and popular topic will make this assignment all the more engaging for your middle school math class. They use Starbucks beverage sales and nutrition values to practice ratios, proportions, statistics, and...
Curated OER
Humongous Vegetables
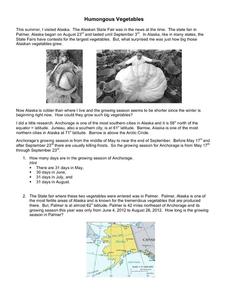
Humongous vegetables can inspire and awaken your mathematicians to the large math concepts in our Common Core standards. What is the secret to growing such gargantuan garden objects in Alaska? In the state that is closest to the North...
Curated OER
Questioning NASA
Space science and math collide in this inquiry that investigates launching times for antacid-tablet rockets! Upper elementary or middle school learners collect data as they launch these mini rockets. They apply concepts of place value...
Curated OER
If the World Were a Village...
Your class members explore concept that the world is a large place, examine how statistics can be used to help in understanding the world and its people, and create illustrations or graphs of statistics found in the award-winning...
Education World
Putting Turkey on a Table (or a Graph)
Grateful learners put turkey on a table (or a graph)! Through a creative project they show statistical information about turkey population, production, and consumption. A great Thanksgiving lesson plan that can be applied at any time to...
Curated OER
Election Poll, Variation 3
Build on probability and incorporate a random number generator to select outcomes for a school election. Your learners will record their results on a dot plot and answer questions regarding whether their candidate has a chance at the...
Curated OER
Election Poll, Variation 2
When a random sample isn't enough, your math class can compare the data from a physical simulation to decide if the probability is still likely. The lesson is part of a probability series that focuses on one question and different ways...
Curated OER
Boorito!
Delicious Chipotle burritos are a big treat, especially when they are offered for only $2.00. This Halloween-themed learning experience isn't tricky, but learners will need to think critically about division with large numbers in order...
Curated OER
West Nile Virus and Lyme Disease: Making Sense of the Numbers
In an interdisciplinary exploration, trace the development of West Nile fever and Lyme diseases. Pupils discover how these diseases are contracted. They collect statistical data and analyze trends.
Curated OER
Oklahoma Stone Soup
Class members complete activities related to the story "Oklahoma Stone Soup." First, pupils read, discuss, and answer questions about the story. Next, to incorporate math into the lesson, learners make stone soup using a variety of...
Texas Instruments
Measure Up!
Statisticians take things to new heights using a set of height measurements. Students use TI-82 or TI-83 calculators to determine extreme values and the median for the data. They also construct a box-and-whisker plot to summarize the...


