Math Worksheets Land
Pie or Circle Graphs - Guided Lesson
A guided lesson worksheet reinforces pie graph skills using a given set of data. Each problem requires young mathematicians to create a circle graph using five colors, and to provide a key that goes along with the graph.
Curated OER
Graphs that Represent Data Sets
These four scenarios all contain graphable data; can scholars match them to the correct bar graphs? All the data is in single-digit whole numbers. Some of the scenarios instruct kids to make a graph, while others don't. Clarify...
Inside Mathematics
Graphs (2006)
When told to describe a line, do your pupils list its color, length, and which side is high or low? Use a activity that engages scholars to properly label line graphs. It then requests two applied reasoning answers.
Houston Area Calculus Teachers
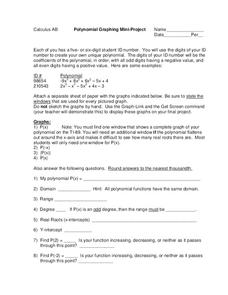
Polynomial Graphing
Your AP Calculus learners probably have their ID numbers memorized, but have they tried graphing them? Pique your pupils' interest by asking each to create a unique polynomial function based on their ID numbers, and then analyze the...
K-5 Math Teaching Resources
Graph Paper
You'll never have to buy graph paper again with this printable resource, which can be used for anything from creating graphs, plotting points in the coordinate plane, or measuring the area and perimeter of polygons. A helpful resource...
Curated OER
Digital Statistics
Research data analysis by creating charts in class. Define the differences between an "average" and "range" while examining measurement data based on student height. Utilize computer software to create a height graph which is shared with...
Curated OER
Graphs to Represent a Data Set
Here are a some pre-made sets of data that kids can use to practice data analysis. There are 10 survey scenarios written out, and scholars synthesize the results of each into a bar graph. In addition to the graphing, they answer two...
Curated OER
Introduce Double-Digit Addition
Pupils generate a list of numbers then classify them into groups of single digit and double-digit numbers. After listening to a children's book about double-digit addition, they work with tens and ones blocks to solve double-digit...
Curated OER
Graphs to Represent a Data Set
By analyzing a word problem about hours worked in a week, scholars get valuable practice with bar graphs and data analysis. They read the scenario, then examine a table of data taken from it. The data includes four days and the...
Curated OER
Graphs that Represent Data Sets
Use these pre-made data sets to introduce kids to bar graphs and data analysis, and then have them take surveys on their own. There are 10 survey scenarios written out here, and scholars synthesize the results of each into a bar graph....
Curated OER
Fast Food Survey Using Bar Graphs
Second graders create a bar graph to pictorically represent the data collected from a survey of students. They use Excel to electronically create the graphs and data tallies. They then interpret their data using sentences to explain.
Curated OER
7th Grade Math Circle Graphs
Seventh graders are able to develop (synthesis) pie graphs with the class and on their own. They are told that pie charts are a graphic representation of material that can be given in the form of parts of a whole by using...
Curated OER
Re-Presenting Race in the Digital Age
Teen-aged scientists analyze a graphic organizer of how trash is removed from New York City and then answer standard questions about a graph and a diagram. Resources are mentioned, but there are no links to these resources, so you will...
Curated OER
Beginning Graphs in MS Excel
Learners practice creating graphs in Microsoft Excel. In this technology instructional activity, students conduct a random survey and collect data. Learners use the Microsoft Excel program to create a bar graph of the data.
Curated OER
How to Graph in Excel
Fourth graders construct data graphs on the Microsoft Excel program. In this statistics lesson, 4th graders formulate questions and collect data. Students represent their results by using Excel.
Curated OER
Graphing Your Motion with Vernier LabQuests
Seventh graders create motion graphs using a motion sensor. In this physics lesson, 7th graders match the graph shown by moving their body. They relate the slope to the way they moved.
Baylor College
Water: The Math Link
Make a splash with a math skills resource! Starring characters from the children's story Mystery of the Muddled Marsh, several worksheets create interdisciplinary connections between science, language arts, and math. They cover a wide...
Baylor College
Global Atmospheric Change: The Math Link
Change up the classroom atmosphere with this interdisciplinary resource. Following along with the children's book Mr. Slaptail's Curious Contraption, these math worksheets provide practice with a wide range of topics including simple...
Curated OER
Graphs Review
Seventh graders review different types of graphs such as bar graphs, line graphs, box & whisker plots. As a class, they read a story and construct graphs to solve the data in the story. Students play "Graph Jeopardy" which requires...
Curated OER
2 Digit Subtraction Worksheets with Regrouping
In these subtraction worksheets, students will subtract single and double digit subtrahends from double digit minuends. Students will need to regroup to solve.
Curated OER
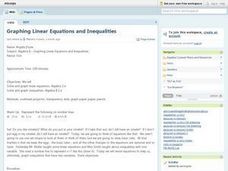
Graphing Linear Equations and Inequalities
Students discuss methods to solve equations and inequalities with one variable. As a review, they write Addition and Subtraction properties of equality and Multiplication and Division properties of equality. Students graph points, write...
Math Worksheet Center
Independent Practice 2: Double Digit Long Division
Twelve division problems are presented for youngsters to practice with. All of them require the division of a four- or five-digit dividend by a two-digit divisor. Some will have remainders. There is probably not enough room for math...
CK-12 Foundation
Stem-and-Leaf Plots and Histograms: Digital Photography
Cameras use histograms to communicate the exposure of a photograph. An interesting lesson uses this idea to help learners deepen their understanding of histograms. It highlights the skew of the graphs by showing under- and overexposed...
Curated OER
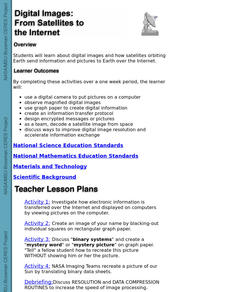
Digital Images: From Satellites To The Internet
Students examine digital images and how satellites orbiting Earth send information and pictures to Earth over the Internet. They use a digital camera to put pictures on a computer and decode a satellite image from space.


